Dave Manuel Logo
Tuesday, March 16, 2010


FRONT PAGE
STOCK QUOTES
SPECIAL FEATURES
REVIEWS
ARTICLE ARCHIVE
NEWSLETTERS
DICTIONARY
TWITTER ALERTS
STOCK TWEETS
U.S. DEBT CLOCK
U.S. UNEMPLOYMENT
ADVERTISE
ARTICLE FEED
BLOG FEED


2008-09-18 02:35:46

A Stunning Collapse of the Financial Sector Has Accelerated in the Past Week


market capitalization chart - financial sector losses in the last year I was scrolling through TechCrunch and noticed an article on their site titled "The Mess on Wall Street: Four Trillion Dollars Down the Drain." The article linked to a New York Times graphic that illustrated just how far 29 selected financial firms have fallen over the past 11 months. The article goes on to say that the entire stock market had lost approximately $4 trillion dollars in market cap during that time period, and that the financial sector had accounted for a whopping one trillion dollars of that total loss.

These were supposed to be the blue-chip companies that never faltered, no matter how weak the economy was. These were the companies that, conspiracy theorists opined, "controlled everything that took place, and everything was to their benefit." These were some of the biggest and most storied companies in the history of the United States.

Some of these companies are gone, never to return. Some went bankrupt. Some were swallowed up by the US government in a desperate bid to prop up the entire financial system. Some, while still breathing, are clearly on life support. Others are still alive and kicking, but have dropped many billions of dollars in market capitalization.

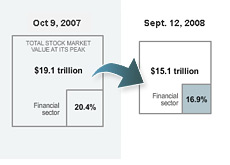
The graphic can be found here. You can see that the New York Times took the market capitalization of 29 "selected financial firms" from October 9th, 2007, and compared it to their market caps on September 12th, 2008.

As you can see, these 29 companies had a combined market cap of $1.86 trillion dollars on October 9th, 2007.

Just 11 short months later, the combined market capitalization was less than a trillion dollars ($0.98 trillion dollars).

I would also like to point out that the combined market capitalizations are significantly lower on September 18th compared to September 12th, when this graph was created.

Here are some examples:

JP Morgan had a market cap of $142.2 billion dollars on September 12th. As of the close of trading on September 17th, that number was down to $123 billion dollars.

Citigroup - $97.8 billion dollar market cap on September 12th. Close of trading on Sept. 17th? $76.4 billion.

Goldman Sachs - $61.3 billion dollar market cap on September 12th. Just five days later? $45.9 billion.

Wachovia - $30.8 billion dollar market cap at the close of trading on September 12th. Five days later? $19.48 billion dollars.

You get the picture. You can walk down the list of the 29 companies and find similar drops.

Even Lehman Brothers, which had a paltry $3.5 billion dollar market cap before the weekend, has seen its market cap shrink to just under $90 MILLION dollars after filing for bankruptcy.

I would guess that the total market capitalization of these 29 companies has dropped to around $800 billion dollars over the last three business days, which is an absolutely mind-blowing loss.

It will be interesting to see where these companies go from here. Can companies like Goldman Sachs and JP Morgan really continue to slip into the dark abyss, or will there be some sort of a cataclysmic bottom put in soon?

Source: Techcrunch


Filed under: The Economic Meltdown | General Market News


Related Articles
-- Warning sign bell - drawing --
Posted on: 2010-03-15 07:44:00
Moody's Fires Another Warning Shot at the United States
-- Hedge fund - 3rd times the charms - illustration --
Posted on: 2010-03-13 06:29:00
John Meriwether - Third Time's A Charm?
-- Unemployment in MIchigan - Automakers - Illustration - Sad cars --
Posted on: 2010-03-11 00:57:00
Unemployment Rate Up in 30 States in January
-- Illustration - Home printer printing U.S. dollar bills - money --
Posted on: 2010-03-10 06:30:00
One Year Ago Today..
-- Illustration of a gold bar / brick  --
Posted on: 2010-03-09 10:11:00
John Paulson's Four Billion Dollar Plus Long Positions


COMMENTS

No comments yet.

Comments are temporarily down.


Stock Market Quotes

Davemanuel.com recently launched its very own stock market quotes page.

1. MOST RECENT NEWS RELEASES

2. MOST RECENT TWITTER POSTINGS

3. MOST RECENT YAHOO FINANCE POSTINGS

4. MOST RECENT BLOG POSTINGS

5. CHARTS


Twitter

246


Dow Jones10660.59+18.440.17%
Nasdaq2372.28+10.070.42%
S&P 5001155.36+4.850.42%


SPECIAL FEATURES

United States Debt Clock

Where Did The DJIA/NASDAQ/S&P 500 Trade On..

History of Deficits and Surpluses in the U.S.

Inflation Calculator

Historical Unemployment Rates in the United States

Historical State Unemployment Rates

Canada Debt Clock

UK National Debt Clock

A History of Bank Failures in the United States

Mortgage Refinancing Calculator

Dow Jones Historical Data

Nasdaq Historical Data

S&P 500 Historical Data

Stock Market Guru Twitter Alerts

Historical Gold Prices

Median Household Income History

State Population Trends Since 2000


BLOG POSTINGS

Always Consider The Source

100 Financial Dictionary Entries

New Tool For Looking Up DJIA / NASDAQ / S&P 500 Historical Data Launches

Beginning of an Era? Ebooks Outsell Physical Books on Amazon.com on Christmas Day

Bernard Madoff Nearly Beaten to Death in Prison

Google Legally Avoids Paying 450 Million Pounds of Tax in Britain Last Year

Historical State Unemployment Rate Tool Launches

How Do The Markets Tend to Perform in December?

More Arrests Made in Galleon Group Insider Trading Case

CNBC Viewership Numbers Are Trending Downwards


FUND HOLDINGS

Farallon Capital Management, L.L.C.

Eton Park Capital Management, L.P.

Conatus Capital Management LP

Bill & Melinda Gates Foundation Trust

Third Point LLC

Paulson and Co. Inc.


REVIEWS

Barbarians at the Gate Book Review

The Dip Book Reviews

Too Big To Fail Book Reviews

Thinkorswim Reviews

Hulbert Interactive Reviews


MOST RECENT DICTIONARY ENTRIES

Material Adverse Change

Ninja Loan

Credit Default Swap

Liar Loan

Mega Cap Stock

Level 3 Assets

Nascent Recovery

Small Cap Stock

Micro Cap Stock

AA Bond Rating


CREDIT CARDS AND OTHER SERVICES

The Top Three Online Stock Brokers In Canada

Questrade Review

Jim Cramer Action Alerts Plus Review

The American Express Platinum Credit Card

Direct Access Brokers: The Best of the Best

Discover More Card Review

American Express Platinum Credit Card Review

American Express Gold Card Review

Questrade Promotional Code - Qualifying for Your Free Commissions

Hulbert Interactive Review

Marketwatch Options Trader Newsletter Review

Retirement Weekly Newsletter Review

Barron's Online Review

Wall Street Journal Subscription - Up to 80% Off Regular Price

Wall Street Journal Subscription Discount

Barron's Subscription Discount - Over 40% Off The Newsstand Price

Barron's Coupon Code


INTERNATIONAL CONTENT

Comment Acheter un Amazon Kindle en France


PROMOTIONS AND OFFERS

Where To Buy a Kindle?

WSJ Subscription Discount - Up to 80% Off

How to Buy an Amazon Kindle in Canada

Amazon Kindle Canada Review

Hercule Poirot DVD Reviews


ARTICLE ARCHIVES

Blog Posts

Company Reviews

Daytrading

General Knowledge

General Market News

Health + Fitness

Hedge Fund News

Internet Companies

Making Money Online

Motivational

Online Forex Trading

Real Estate News

Stock Market Education

Stock Market Scandals

The Economic Meltdown

Trader Profiles


DaveManuel.com - Copyright 2010, All Rights Reserved | Advertise | Privacy Policy | Disclaimer