Dave Manuel Logo
Saturday, November 07, 2009


FRONT PAGE
QUOTES
ARTICLE ARCHIVE
NEWSLETTERS
DICTIONARY
TWITTER ALERTS
STOCK TWEETS
U.S. DEBT CLOCK
U.S. UNEMPLOYMENT
ADVERTISE
ARTICLE FEED
BLOG FEED


2009-04-16 01:09:50

Nikkei 225 Hit All-Time High of 38,957.00 on December 29th, 1989


tokyo stock exchange - 225 index - nikkei - graph - 1970 - 2009 
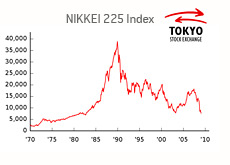
On December 29th, 1989, the Nikkei 225 hit an all-time high of 38,957.00.

The Nikkei 225 is a stock market index that contains 225 of Japan's largest publicly traded companies, including the likes of Toyota, Honda, Sony and Toshiba.

The Nikkei 225 is similar to the Dow Jones Industrial Average, in that it contains companies from a wide variety of different industries, including electronics, manufacturing and insurance.

Anyways, from the early 1970s until December of 1989, the Nikkei 225 basically went straight up.

From 1985 to the end of 1989, the chart for the Nikkei 225 really went parabolic, trading from around 10,000 to an unbelievable 38,915.87 in just a few short years.

There was obviously an unbelievable amount of wealth created during the late 1980s in Japan - I mean, imagine if the Dow Jones Industrial Average traded from 10,000 to almost 40,000 in just five years.

All good things must come to an end, and the rapid rise in Japanese stocks came to an abrupt halt in the 1990s.

The 1990s is now referred to as the "Lost Decade" in Japan - speculative excesses were wrung out of both the real estate and stock markets, and economic growth was nowhere to be found. The country took on an enormous amount of debt in an attempt to stimulate their lifeless economy - however, these efforts were largely in vain, as the economy endured a long, L-shaped depression.

Robust growth in the Japanese economy, once referred to as the "Japanese miracle", had now been extinguished.

Japan, FYI, is the second largest economy in the world, with a total GDP of around $4.38 trillion dollars (as of 2007). This is larger than Germany, China, the UK and France.

20 years later, the Nikkei 225 is currently trading at 8,755.26.

This is around 22% of what the index was trading at in the late 1980s.

Why am I telling you this?

I've lost count of the number of people who have told me that they are just going to sit on their long-term investments indefinitely, because the "market always comes back over time".

Sure, the Dow might top 13,000 again in the future.

The S&P 500 might just trade above 1,440 once again.

Heck, maybe the Nasdaq will return to its glory days and trade over 5,000. Anything is possible.

I'm just saying - you NEED to consider the possibility that stocks may take decades to "come back".

There are probably people in Japan that are still holding from 20 years ago, hoping that the Nikkei 225 "comes back".

When you consider that their money has lost value due to inflation, the carnage becomes even worse.

Japan isn't some tiny nation that you should ignore - they have, as mentioned, the second largest economy in the world.

Just some food for thought for you. The markets don't ALWAYS come back. Stocks don't ALWAYS come back. This is what money managers and stock brokers tell you so that you will continue to park your money with them.

These are incredibly uncertain and unique times that we are currently living through right now. Nothing is guaranteed, including any future returns in your portfolio.

Filed under: Stock Market Education


COMMENTS

Comment by Alan on October 31, 2009 @ 8:11 pm

You got it right. The law of averages and past history mean nothing when it ces to predicting the future.

--

Leave a comment

 Name (required)

 Your Website

Your Comment (required)


Most Recent Articles
-- unemployment graph - 1999 - 2009 - united states --
Posted on: 2009-11-06 09:27:00
October Unemployment Rate Comes In at 10.2%
-- graph showing unemployment in the united states for the 2009 year - what is the october unemployment figure going ot be? --
Posted on: 2009-11-05 22:42:00
Could The Unemployment Rate Hit 10% Tomorrow?
-- gold bars with an arrow pointing up - raising gold prices --
Posted on: 2009-11-04 08:28:00
Gold Continues to March Higher
-- sears holiday shopping - black friday a month early --
Posted on: 2009-11-02 12:15:00
Retailers Bracing For An Abysmal 2009 Holiday Shopping Season
-- cit logo - 5 day graph - going down --
Posted on: 2009-10-31 12:31:00
Say Goodbye To $2.3 Billion Dollars


Subscribe to My RSS Feed


Click My Picture Above
To Subscribe To The RSS Feed


Twitter

260


Dow Jones10023.42+17.460.17%
Nasdaq2112.44+7.120.34%
S&P 5001069.30+2.670.25%


BLOG POSTINGS

More Arrests Made in Galleon Group Insider Trading Case

CNBC Viewership Numbers Are Trending Downwards

Amazon.com Surges to New All-Time High After Q3 Earnings

A Record Number of Foreclosure Filings In Q3 2009

Bernard Madoff Reportedly Gets Into a Fight in Prison

Spot Gold Price Hits New All Time High

Is the World Bank Running Out of Money?

Cramer Slammed For Ill-Timed CIT Call

US Income Gap Continues to Widen

Over 35 Million Americans Receiving Food Stamps


TOP FIVE MOST POPULAR ARTICLES

The Top Ten Most Outrageous Stock Market Scams of all Time

The Top Twelve Stock Market Scams of the Last Twelve Years

The Real Unemployment Rate Is Much Worse Than 8.1%

The Seven Most Crooked CEOs of All Time

Think that the SEC Is Corrupt? Meet Gary Aguirre


MOST RECENT DICTIONARY ENTRIES

Form 8-K

Black Friday

Zombie Bank

Consensus Estimate

Chinese Wall

Front Running

T.2 Trading Halt Code

Bank Run

Earnings Blowout

Whisper Number


CREDIT CARDS AND OTHER SERVICES

The Top Three Online Stock Brokers In Canada

Free Real-Time Stock Quotes: Some Of The Best Resources

FreeCreditReport.com Review - The Facts Revealed

Questrade Review

Jim Cramer Action Alerts Plus Review

0% Balance Transfer Credit Card Offers - Do They Exist?

The American Express Platinum Credit Card

Direct Access Brokers: The Best of the Best

Discover More Card Review

American Express Platinum Credit Card Review

Discover Student Card Review

American Express Gold Card Review

American Express Delta Skymiles Card Review

The Best Reward Credit Cards

Questrade Promotional Code - Qualifying for Your Free Commissions

Optionshouse Review

Hulbert Interactive Review

Marketwatch Options Trader Newsletter Review

Retirement Weekly Newsletter Review

The Three Most Prestigious Credit Cards In the World

Barron's Online Review

Retirement Newsletters: Which One Is the Best?

Thestreet.com RealMoney Review

Proactive Fund Investor Newsletter Review

The Best Online Brokerage in Canada (In My Opinion)

Wall Street Journal Subscription - Up to 80% Off Regular Price


PROMOTIONS AND OFFERS

Free Payday Loan Quotes

Optionshouse Promotion Code - Qualifying For Your Free 100 Trades


FOREX

How to Become a Great Forex Trader

Who Offers Automated Forex Trading?

Forex Broker Reviews

Two of the Best Online Forex Brokers in the World

The Top Two Forex Brokers in Canada


SPECIAL FEATURES

United States Debt Clock

History of Deficits and Surpluses in the U.S.

Inflation Calculator

Historical Unemployment Rates in the United States

Canada Debt Clock

UK National Debt Clock

A History of Bank Failures in the United States

Mortgage Refinancing Calculator

Dow Jones Historical Data

Nasdaq Historical Data

S&P 500 Historical Data

Stock Market Guru Twitter Alerts


OTHER

Mortgage Refinancing

Home Equity Loans


MARKET INFORMATION

Top Nasdaq Gainers by Percentage

Top NYSE Gainers by Percentage


ARTICLE ARCHIVES

Blog Posts

Company Reviews

Daytrading

General Knowledge

General Market News

Health + Fitness

Hedge Fund News

Internet Companies

Making Money Online

Motivational

Online Forex Trading

Real Estate News

Stock Market Education

Stock Market Scandals

The Economic Meltdown

Trader Profiles


DaveManuel.com - Copyright 2009, All Rights Reserved | Advertise | Privacy Policy | Disclaimer