All Three Major North American Stock Market Indexes Down From December 1999
 With 2009 drawing to a close, it's time to take a look at how the major North American stock market indexes have performed over the past decade.
 It's hard to believe that it's been a decade since we were worrying about the "Y2K bug". It's also hard to believe that it's been a decade since the dot-com bubble started to deflate and then collapse altogether.
With just a week left in 2009, it appears as though the major North American stock market indexes will close at around these levels:
DJIA - 10,500
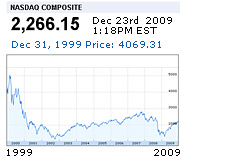
NASDAQ - 2,275
S&P 500 - 1,125
Where did these indexes close at on December 31st, 1999? Let's take a look:
DJIA - 11,497.12
NASDAQ - 4,069.31
S&P 500 - 1,469.25
Ugly! Let's break out the calculators for a second:
The DJIA is down about 9.1% from December 31st, 1999.
The NASDAQ is down about 44% from December 31st, 1999.
The S&P 500 is down about 23.5% from December 31st, 1999.
Thankfully the major North American indexes staged a frantic rally over the past 8-9 months or so, or else these numbers would have been even uglier.
So, if you invested any of your hard-earned dollars in any of the three index tracking stocks (DIA, SPY or QQQQ), then you would be down substantially over the past 10 years.
Bad, right?
It gets worse.
Let's not forget about inflation!
According to the Bureau of Labor Statistics, $1 of 1999 dollars is worth about $1.29 today.
So, in order to keep up with inflation, a $100,000 investment made in 1999 would need to be worth about $129,000 today. That would be break-even, taking into account inflation.
So, a $100,000 investment in DIA (DJIA tracking stock) made in 1999 would only be worth $91,000 in 2009 dollars.
However, after taking into account inflation, the investment would have fared even worse.
The DJIA (Dow Jones Industrial Average) has performed (by far) the best of the three major North American indexes in the '00s.
You can imagine how ruinous a ten-year investment in SPY or QQQQ would have been over that same time, especially when taking into account inflation.
Source: Inflation Calculator
Graph: Google Finance - NASDAQ Composite
Filed under: The Economic Meltdown


