Highest Average National Unemployment Rate Since 1983
 2009 was a bad year in terms of the national unemployment rate.
 The rate, which started out at 7.6% in January of 2009, was at 10% by the time that the year was over.
Averaged out from Jan-Dec of 2009, the national unemployment rate clocked in at 9.26%.
This is an extremely high rate, but only the third highest since the Bureau of Labor Statistics started tracking these statistics in 1948.
1982 still lays claim to the highest average unemployment rate on record, as the national unemployment rate clocked in at an average of 9.71% that year.
1983 was nearly as bad as the year before, as the average national unemployment rate was 9.6%.
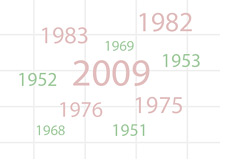
Here are the top five years since 1948 in terms of the highest average national unemployment rates:
1. 1982 - 9.71%
2. 1983 - 9.6%
3. 2009 - 9.26%
4. 1975 - 8.48%
5. 1976 - 7.7%
On the flip side, here are the five lowest years in terms of the average national unemployment rate since 1940:
1. 1953 - 2.93%
2. 1952 - 3.03%
3. 1951 - 3.28%
4. 1969 - 3.49%
5. 1968 - 3.56%
--
When all is said and done, 2010 stands an excellent chance of knocking 1982 off of the top of the list.
The CBO (Congressional Budget Office) estimates that the average unemployment rate in 2010 will be 10.1%, followed by 9.5% in 2011.
If the 10.1% rate for 2010 comes to fruition, then this would easily top 1982's high-water mark.
Source: Historical Unemployment Rates
Filed under: The Economic Meltdown


