Will This Streak Be Broken Anytime Soon?
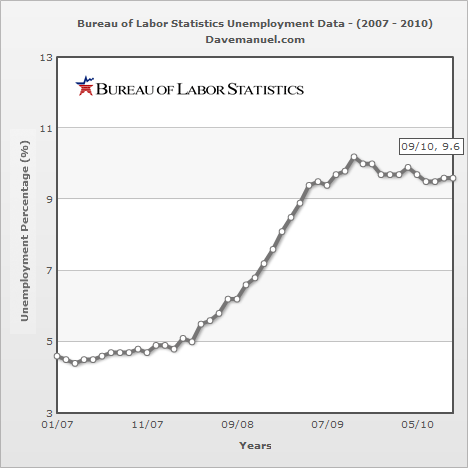
 For the 14th consecutive month, the US national unemployment rate has topped 9.5%. This is the longest such streak on record since the Bureau of Labor Statistics (BLS) started keeping monthly records in 1948.
 You have to go back to July of 2009 (9.4%) to find the last month when the national unemployment rate was less than 9.5%.
Since then, the rates have looked like this:
August 2009 - 9.7%
September 2009 - 9.8%
October 2009 - 10.2%
November 2009 - 10%
December 2009 - 10%
January 2010 - 9.7%
February 2010 - 9.7%
March 2010 - 9.7%
April 2010 - 9.9%
May 2010 - 9.7%
June 2010 - 9.5%
July 2010 - 9.5%
August 2010 - 9.6%
September 2010 - 9.6%
There you have it - 14 straight months when the national unemployment rate topped 9.5%.
With September's unemployment rate coming in at 9.6%, you may be wondering if this streak will be broken anytime soon.
The answer? Probably not.
Goldman Sachs, for instance, is currently on the record as saying that the national unemployment rate will AVERAGE 10% in 2011. Here is a breakdown of their quarterly estimates for 2011:
Q1 - 9.9%
Q2 - 10.0%
Q3 - 10.0%
Q4 - 10.0%
I don't see anything close to a sub 9.5% number in there.
Projections from other firms and economists seem to come to the same conclusion - the national unemployment rate will hover around 10% throughout the entirety of 2011.
This means that we are likely looking at a month in 2012 when this "streak" will be broken. Let's assume that the unemployment rate finally dips below 9.5% halfway through 2012. This would mean that the "streak" will be up to 35-36 months by that time - absolutely unbelievable.
The last time that we had a similar "streak" was in 1982-1983, when the United States was buckling under the pressures of stagflation (high inflation plus weak economic activity). That "streak" lasted a total of 13 months, starting in June of 1982 and finishing in July of 1983.
It can be a bit hard to wrap your head around the fact that this "streak" might end up being nearly three times as long as the one that took place in 1982-1983.
Source: Davemanuel.com - Historical Unemployment Rates in the United States
Filed under: The Economic Meltdown


