Dave Manuel Logo
Wednesday, May 16, 2012
Click Here to Subscribe to My Free Newsletter

DaveManuel.com BLOG POSTS
FRONT PAGE
SEARCH
INSIDER FILINGS
CONTACT ME
SPECIAL FEATURES
NEWSLETTERS
INTERNATIONAL
REFINANCING
TRADING ACADEMY
ARTICLE ARCHIVE
BLOG POSTS
DICTIONARY
U.S. DEBT CLOCK
SUPERPAC SPENDING
U.S. UNEMPLOYMENT
ANSWERS
INFOGRAPHICS
PERSONAL FINANCE
REVIEWS
NEWSLETTER
ADVERTISE
ARTICLE FEED
BLOG FEED


2010-12-02 07:55:00

CBO Now Estimates That TARP Will Cost Taxpayers $25 Billion


CBO - Tarp Cost Estimates - August 2010 - November 2010 Earlier this week, the CBO (Congressional Budget Office) released a report titled "Report on the Troubled Asset Relief Program - November 2010".

In October of 2008, during the height of the financial crisis, the Emergency Economic Stabilization Act of 2008 was signed into law by President George W. Bush.

The Emergency Economic Stabilization Act of 2008 established the Troubled Asset Relief Program (TARP). TARP gave the Department of Treasury the authority to spend up to $700 billion on the purchase of failing bank assets in order to shore up the financial system and restore confidence to credit markets. In addition, the Department of Treasury also sought to provide capital injections to banks through TARP.

TARP was much-maligned at the time, and many people wondered how the federal government could just give away $700 billion in taxpayer's money to the very institutions that had gotten the country into such a mess in the first place.

In reality, the $700 billion figure was pretty much plucked out of the air during the height of the crisis. A number had to be agreed upon before President Bush signed the bill creating TARP into law, and $700 billion was the agreed upon number. In the Dodd-Frank Wall Street Reform and Consumer Protection Act, the maximum authority for TARP was subsequently reduced to $475 billion.

--

According to the CBO, the total cost to the US taxpayer for TARP is now estimated to be around $25 billion. This is significantly less than previous estimates from the CBO, and is also significantly less than the OMB's (Office of Management and Budget) current estimate of $113 billion.

The CBO states in their report that the total cost of TARP is now only $25 billion due to a stabilized and improving financial system, which has resulted in many of the transactions that were undertaken by the government receiving "favorable" outcomes.

--

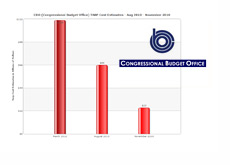
In March of 2010, the CBO estimated that the total cost to taxpayers of TARP would be $109 billion.

In August of 2010, the CBO estimated that the total cost to taxpayers of TARP would be $66 billion.

In November of 2010, the CBO estimated that the total cost to taxpayers of TARP would fall once again, this time to $25 billion.

According to the CBO, four major factors account for the steadily declining estimated costs over the past year:

1. Market Value of Treasury's CPP (Capital Purchase Program) and AIG investments increased. The Capital Purchase Program saw the Treasury Department purchase $205 billion worth of preferred shares from 707 financial institutions, and most of this money has already been paid back (resulting in a profit for the government).

2. Estimated cost of Assistance to the auto industry fell from $34 billion to $19 billion. The CBO points out that auto companies have settled or repaid much of their debt and seem to be on solid financial footing now.

3. Estimated participation in Treasury's mortgage programs declined, resulting in total expected reduced expenditures of $12 billion (down from $22 billion).

4. Treasury's authority to fund new programs under TARP has expired.

--

In short, the estimates for the total cost to the US taxpayer for the Troubled Asset Relief Program continue to be whittled down, and are now currently sitting at $25 billion.


CBO Tarp Cost Estimate Difference - March - November 2010


Source: CBO.gov -
Report on the Troubled Asset Relief Program, November 2010

Source: Wikipedia.org - Troubled Asset Relief Program


Filed under: The Economic Meltdown


COMMENTS - What Say You?

No comments yet.

Leave a Reply

Name:


Web Site:


Your Comment:


Related Articles
Movie Theater Visit Decline - Illustration
Posted on: 2011-12-29 18:54:00
American Households Continue To Avoid Movie Theaters
United States Congress logo
Posted on: 2011-11-14 15:37:00
Should Members of Congress Be Allowed to Trade Using Insider Information?
CBO - Congressional Budget Office - Logo - Without text
Posted on: 2011-03-08 05:32:00
CBO: February Deficit Was Likely a Record of $223 Billion
The Graph of Last 3 Years in the Finance World
Posted on: 2010-12-03 10:00:00
It's Now Been Three Years Since The "Great Recession" Started..
Illustration of a pile of cash
Posted on: 2010-07-22 03:41:00
Estimated $3.7 Trillion in Taxpayer Dollars Have Been Committed By US To Support Financial System


REVIEWS OF TOP ONLINE FOREX BROKERS

EtoroVisit
ForexyardVisit
QuestradeVisit


Twitter

316


SPECIAL FEATURES

Debt Ceiling Changes (1940-Present)

United States Debt Clock

Where Did The DJIA/NASDAQ/S&P 500 Trade On..

Historical GDP Numbers for the United States

US Government Spending Breakdown 1962-2015

History of Deficits and Surpluses in the U.S.

History of Debt In The United States

Largest Foreign Holders of US Debt

Inflation Calculator

Historical Unemployment Rates in the United States

Historical State Unemployment Rates

Canada Debt Clock

A History of Bank Failures in the United States

Dow Jones Historical Data

Nasdaq Historical Data

S&P 500 Historical Data

Median Household Income History

Compound Interest Calculator

List of Failed US Banks 2000-Present


BLOG POSTINGS

Historical iPhone Sales Infographic

Who Are The Largest Holders of Facebook Stock?

Can Mitt Romney Win in 2012?

Weekly SuperPAC Update: Restore Our Future, Inc. and Winning Our Future Spend Over $10 Million Combined

Joe Biden, The Everyman (Financially Speaking)

How Much Debt Did the United States Have When Barack Obama Took Office?

Ron Paul's Portfolio: An Apocalyptic Vision of the Future

NHL Franchise Values Before and After the 2004-2005 Lockout

A Look at Barack Obama’s Investment Portfolio

A Look at the UFC: Debt, Finances and Future Growth


POLITICAL NET WORTH

Rick Santorum Net Worth

Newt Gingrich Net Worth

Mitt Romney Net Worth

Ron Paul Net Worth

Joe Biden Net Worth

Barack Obama Net Worth


SUPERPACS

Endorse Liberty Inc

Winning Our Future

Restore Our Future, Inc.


MOST RECENT DICTIONARY ENTRIES

High Risk Investment

Appraisal

Rigged Markets

Accounts Payable

Net 30

Bad Debt

Accounts Receivable

Compound Interest

Retail Shrinkage

Income Inequality


CREDIT CARDS AND OTHER SERVICES

The Top Three Online Stock Brokers In Canada

The Top Two Forex Brokers in Canada

Wall Street Journal Weekend Only Edition Subscription Discount

Islamic Forex Accounts - Who Offers Them?

Questrade Promotion Code

Etoro Review


INTERNATIONAL CONTENT

Etoro Rezension

Les Deux Meilleurs Courtiers Forex Au Quebec

Online Forex - Recensioner på Forexmäklare

Forex En Ligne - Des Avis Sur Des Courtiers Forex

Онлайн Forex - Отзывы о Forex брокерах

Online Forex - recenze Forex brokerů

Online-Forex - Übersicht der Forex-Broker

Forex Online - Recensioni di Mediatori Forex

Wie Sie den für sich richtigen Forex-Broker auswählen

Wie kaufen Sie Öl, Gold und Silber?


ARTICLE ARCHIVES

Blog Posts

Company Reviews

Daytrading

General Knowledge

General Market News

Health + Fitness

Hedge Fund News

Internet Companies

Making Money Online

Motivational

Online Forex Trading

Real Estate News

Stock Market Education

Stock Market Scandals

The Economic Meltdown

Trader Profiles


DaveManuel.com - Copyright 2012, All Rights Reserved | Advertise | Privacy Policy | Disclaimer