Dave Manuel Logo
Wednesday, May 16, 2012
Click Here to Subscribe to My Free Newsletter

DaveManuel.com BLOG POSTS
FRONT PAGE
SEARCH
INSIDER FILINGS
CONTACT ME
SPECIAL FEATURES
NEWSLETTERS
INTERNATIONAL
REFINANCING
TRADING ACADEMY
ARTICLE ARCHIVE
BLOG POSTS
DICTIONARY
U.S. DEBT CLOCK
SUPERPAC SPENDING
U.S. UNEMPLOYMENT
ANSWERS
INFOGRAPHICS
PERSONAL FINANCE
REVIEWS
NEWSLETTER
ADVERTISE
ARTICLE FEED
BLOG FEED


2010-12-06 04:08:00

Top 1% of Income Earners Made 20% of Total Adjusted Gross Income in 2008


Amount of Adjusted Gross Income Earned by the Top One Percent of the Earners In 1987, the top 1% of income earners in the United States earned 12.32% of the total AGI (adjusted gross income) in the country.

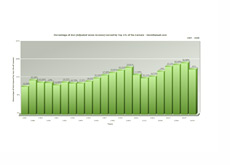
In 2008, the top 1% of income earners in the United States earned 20.00% of the total AGI (adjusted gross income) in the country. A year earlier, this number had reached a lofty 22.83%, a near doubling of 1987's figure.

Let's look at the progression from 1987 until 2008:

1987 - 12.32%
1988 - 15.16%
1989 - 14.19%
1990 - 14.00%
1991 - 12.99%
1992 - 14.23%
1993 - 13.79%
1994 - 13.80%
1995 - 14.60%
1996 - 16.04%
1997 - 17.38%
1998 - 18.47%
1999 - 19.51%
2000 - 20.81%
2001 - 17.53%
2002 - 16.12%
2003 - 16.77%
2004 - 19.00%
2005 - 21.20%
2006 - 22.06%
2007 - 22.83%
2008 - 20.00%


The Rise of the Top One Percent of Earners


The top 5% of income earners have seen their share of the total adjusted gross income pie grow as well. In 1987, the top 5% of income earners in the country earned 25.67% of the total adjusted gross income - by 2008, this number had jumped to 34.73% after hitting a high of 37.44% the year before.

--

As you can probably guess, this jump for the top 5% of income earners means that other groups had seen their shares drop, and drop considerably.

The drop starts at those who fall in the "between 5-10% of income" range, which worked out to those making between $113,799 and $159,619 in 2008.

In 1987, this group of people earned 11.23% of total adjusted gross income in the country. This number more or less has remained the same from 1987 to 2008, with the 2008 number coming in at 11.03%.

How about those Americans who fell in the "between 10-25%" AGI (Adjusted Gross Income) group?

In 1987, this group made 23.85% of the total adjusted gross income in the country. By 2007, this group saw their share fall to just 20.66% before bouncing back slightly (21.62%) in 2008.

The drops continue to get more noticeable as we get into the between 25-50% and bottom 50% groups.

In 1987, the between 25-50% group earned 23.62% of total adjusted gross income. This number fell considerably over the years, touching a low of 19.04% in 2007. In 2008, the between 25-50% adjusted gross income range group earned 19.86% of total adjusted gross income in the country.

How about the bottom 50% group?

In 1987, this group of Americans earned 15.63% of total adjusted gross income in the country.

In 2008, this group of Americans earned 12.75% of total adjusted gross income in the country.

--

Here's a breakdown of the different income categories:

Top 1% - Over $380,354
Top 5% - Over $159,619
Top 10% - Over $113,799
Top 25% - Over $67,280
Top 50% - Over $33,048
Bottom 50% - $33,048 and Lower

As I noted in this article, the top 1% of income earners in the United States paid 38.02% of all federal individual income tax collected in 2008.

Here is the breakdown for all income groups:

Top 1% (Income Split Point $380,354) Paid 38.02% of Federal Individual Income Taxes
Top 5% (Income Split Point $159,619) Paid 58.72% of Federal Individual Income Taxes
Top 10% (Income Split Point $113,799) Paid 69.94% of Federal Individual Income Taxes
Top 25% (Income Split Point $67,280) Paid 86.34% of Federal Individual Income Taxes
Top 50% (Income Split Point $33,048) Paid 97.30% of Federal Individual Income Taxes
Bottom 50% (Anyone Making Less Than $33,048) Paid 2.7% of Federal Individual Income Taxes


Source: Tax Foundation - Summary of Latest Federal Individual Income Tax Data


Filed under: General Knowledge


1 COMMENT - What Say You?

Comment by hogndasboat on December 25, 2010 @ 12:53 pm

I would like to know the breakdown in the hundreds of the top 1 percent since 1987 to the present. Thank you for your diligence.

--

Leave a Reply

Name:


Web Site:


Your Comment:


Related Articles
Surplus - Illustration
Posted on: 2012-05-08 22:30:00
Surprise! United States Posts a Surplus in April
France - Country outline and flag - Illustration
Posted on: 2012-04-22 12:20:00
"Buffett Rule on Steroids" May Be Coming to France
Barack Obama - Campaign Photo
Posted on: 2012-04-13 15:10:00
How Much Did the Obamas Make Last Year?
Groupon logo
Posted on: 2012-04-05 15:57:00
Groupon Continues to Struggle Post-IPO
Tax Documents - Illustration
Posted on: 2012-02-16 19:11:00
Some Interesting Tax Facts and Figures From the Tax Foundation


REVIEWS OF TOP ONLINE FOREX BROKERS

EtoroVisit
ForexyardVisit
QuestradeVisit


Twitter

316


SPECIAL FEATURES

Debt Ceiling Changes (1940-Present)

United States Debt Clock

Where Did The DJIA/NASDAQ/S&P 500 Trade On..

Historical GDP Numbers for the United States

US Government Spending Breakdown 1962-2015

History of Deficits and Surpluses in the U.S.

History of Debt In The United States

Largest Foreign Holders of US Debt

Inflation Calculator

Historical Unemployment Rates in the United States

Historical State Unemployment Rates

Canada Debt Clock

A History of Bank Failures in the United States

Dow Jones Historical Data

Nasdaq Historical Data

S&P 500 Historical Data

Median Household Income History

Compound Interest Calculator

List of Failed US Banks 2000-Present


BLOG POSTINGS

Historical iPhone Sales Infographic

Who Are The Largest Holders of Facebook Stock?

Can Mitt Romney Win in 2012?

Weekly SuperPAC Update: Restore Our Future, Inc. and Winning Our Future Spend Over $10 Million Combined

Joe Biden, The Everyman (Financially Speaking)

How Much Debt Did the United States Have When Barack Obama Took Office?

Ron Paul's Portfolio: An Apocalyptic Vision of the Future

NHL Franchise Values Before and After the 2004-2005 Lockout

A Look at Barack Obama’s Investment Portfolio

A Look at the UFC: Debt, Finances and Future Growth


POLITICAL NET WORTH

Rick Santorum Net Worth

Newt Gingrich Net Worth

Mitt Romney Net Worth

Ron Paul Net Worth

Joe Biden Net Worth

Barack Obama Net Worth


SUPERPACS

Endorse Liberty Inc

Winning Our Future

Restore Our Future, Inc.


MOST RECENT DICTIONARY ENTRIES

High Risk Investment

Appraisal

Rigged Markets

Accounts Payable

Net 30

Bad Debt

Accounts Receivable

Compound Interest

Retail Shrinkage

Income Inequality


CREDIT CARDS AND OTHER SERVICES

The Top Three Online Stock Brokers In Canada

The Top Two Forex Brokers in Canada

Wall Street Journal Weekend Only Edition Subscription Discount

Islamic Forex Accounts - Who Offers Them?

Questrade Promotion Code

Etoro Review


INTERNATIONAL CONTENT

Etoro Rezension

Les Deux Meilleurs Courtiers Forex Au Quebec

Online Forex - Recensioner på Forexmäklare

Forex En Ligne - Des Avis Sur Des Courtiers Forex

Онлайн Forex - Отзывы о Forex брокерах

Online Forex - recenze Forex brokerů

Online-Forex - Übersicht der Forex-Broker

Forex Online - Recensioni di Mediatori Forex

Wie Sie den für sich richtigen Forex-Broker auswählen

Wie kaufen Sie Öl, Gold und Silber?


ARTICLE ARCHIVES

Blog Posts

Company Reviews

Daytrading

General Knowledge

General Market News

Health + Fitness

Hedge Fund News

Internet Companies

Making Money Online

Motivational

Online Forex Trading

Real Estate News

Stock Market Education

Stock Market Scandals

The Economic Meltdown

Trader Profiles


DaveManuel.com - Copyright 2012, All Rights Reserved | Advertise | Privacy Policy | Disclaimer