Food Prices Now Higher Than 2007-08 Levels
 According to the Food and Agriculture Organization (FAO) of the United Nations, global food prices have increased dramatically over the past 12 months.
 The FAO has something called the FAO Food Price Index, which, according to their site, "is a measure of the monthly change in international prices of a basket of food commodities" and "consists of the average of 6 commodity group price indices" including meat, dairy, cereals, oils+fats and sugar. According to the FAO, "55 commodity quotations considered by FAO commodity specialists as representing the international prices of the food commodities noted are included in the overall index".
According to the FAO, the Food Price Index traded at 90 in 2000. Let's look at the data from 2000-2009:
2000 - 90
2001 - 92
2002 - 90
2003 - 98
2004 - 111
2005 - 115
2006 - 122
2007 - 154
2008 - 191
2009 - 152
As you can see, a dramatic increase took place in 2007 and 2008, only to be followed by a dramatic drop to 152 in 2009.
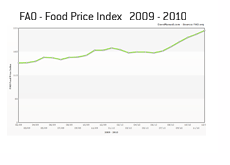
Now let's look at the monthly breakdown of the data from December of 2009 through to December of 2010:
Dec/09 - 172
Jan/10 - 174
Feb/10 - 170
Mar/10 - 163
Apr/10 - 165
May/10 - 164
Jun/10 - 163
Jul/10 - 167
Aug/10 - 177
Sep/10 - 188
Oct/10 - 199
Nov/10 - 206
Dec/10 - 215

As you can see, the first seven months of 2010 were pretty flat, followed by a surge in the index from August to December. From July to December of 2010, the Food Price Index surged nearly 29%.
Now let's take a look at the performance of the individual indices that comprise the FAO Food Price Index over the past number of years:
Meat - 94 in 2000, 120 by December of 2009. From December 2009 to December 2010, the Meat Price Index moved from 120 to 142
Dairy - 95 in 2000, 216 by December of 2009. From December 2009 to December 2010, the Dairy Price Index has moved from 216 to 208
Cereals - 85 in 2000, 171 by December of 2009. From December 2009 to December 2010, the Cereals Price Index has moved from 171 to 238
Oils and Fats - 68 in 2000, 169 by December of 2009. From December 2009 to December 2010, the Oils and Fats index has moved from 169 to 263
Sugar - 116 in 2000, 334 by December of 2009. From December 2009 to December 2010, the Sugar Index has moved from 334 to 398
--
Food prices have now spiked past the levels seen during the 2007-08 food crisis, which should be worrying news to just about everyone.
Source: FAO.org - World Food Situation, Food Price Indices, January 2011
Filed under: General Knowledge


