Dave Manuel Logo
Tuesday, May 22, 2012
Click Here to Subscribe to My Free Newsletter

DaveManuel.com BLOG POSTS
FRONT PAGE
SEARCH
INSIDER FILINGS
CONTACT ME
SPECIAL FEATURES
INFOGRAPHICS
NEWSLETTERS
REFINANCING
TRADING ACADEMY
ARTICLE ARCHIVE
BLOG POSTS
DICTIONARY
U.S. DEBT CLOCK
SUPERPAC SPENDING
U.S. UNEMPLOYMENT
ANSWERS
PERSONAL FINANCE
REVIEWS
NEWSLETTER
INTERNATIONAL
ADVERTISE
ARTICLE FEED
BLOG FEED


January 10th, 2011 11:09 pm EST

Can Netflix Continue Its Torrid Run in 2011?


Netflix (NFLX) was one of the biggest winners of 2010.

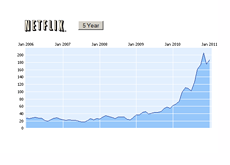
The stock, which traded at $55.09 per share to start 2010, ended the year at $175.70. Netflix was certainly one of the biggest success stories of 2010, and made its investors very, very happy. The Netflix model, which many people openly laughed at when the company was just starting out, has proved to be wildly successful.

Netflix NFLX - 5 Year Chart - January 10th, 2011Anytime a multi-billion dollar company triples in value over the course of just one year, you are going to have critics coming out of the woodwork.

One of those critics is Whitney Tilson, founder and managing partner of T2 Partners LLC.

Tilson released a 22 page document last year titled "Why We're Short Netflix" in which he eloquently laid out his reasons for his company being short NFLX. Tilson gave a number of reasons for his short position in the company, and argued that Netflix was currently priced to perfection. Tilson's public critique of NFLX prompted a response from Reed Hastings, who is the CEO of Netflix.

According to the NFLX profile on Yahoo.com, there are currently over 11 million shares of NFLX short, which represents nearly 30% of the float.

--

I thought that it would be interesting to see what kind of support NFLX had from institutional investors - at least from the 97 institutional investors that we currently track in our database.

Of the 97 institutional investors that we track, only 18 reported owning positions in NFLX at the end of the third quarter. This is a fairly low number for such a visible company - Apple, for instance, had 47 of the 97 institutional investors that we track reporting long positions as of September 30th, 2010.

So, which of the institutional investors that we track reported owning positions in NFLX as of the end of the third quarter? Let's take a look:

1) AQR CAPITAL MANAGEMENT LLC (29,300 shares)
2) Black River Asset Management LLC (200 shares)
3) BLUE RIDGE CAPITAL HOLDINGS LLC/BLUE RIDGE CAPITAL (500,000 shares)
4) Calamos Advisors LLC (452,779 shares)
5) CITADEL ADVISORS LLC (10,993 shares)
6) COATUE MANAGEMENT LLC (215,000 shares)
7) D. E. Shaw & Co., INC. (4,320 shares)
8) DENALI ADVISORS LLC (25,400 shares)
9) DUQUESNE CAPITAL MANAGEMENT L L C (17,000 shares)
10) FMR LLC (5,016,103 shares)
11) GOLDMAN SACHS GROUP INC (218,064 shares)
12) JANUS CAPITAL MANAGEMENT LLC (182,700 shares)
13) MAZAMA CAPITAL MANAGEMENT INC (2,535 shares)
14) MILLENNIUM MANAGEMENT LLC (2,400 shares)
15) RENAISSANCE TECHNOLOGIES LLC (1,648,300 shares)
16) SAC Capital Advisors LP (5,689 shares)
17) Soros Fund Management LLC (25,000 shares)
18) TWO SIGMA INVESTMENTS LLC (84,564 shares)

There are some well-known institutional investors in there, but a number of them only own relatively small positions (compared to their other holdings) in NFLX. There are a couple of obvious exceptions (FMR LLC, Renaissance Technologies).

According to Yahoo!, 364 institutions are currently holding shares of NFLX. For comparison's sake, AAPL currently has 1,519 and GOOG has 1,213.

--

Given the move that NFLX made over the past 12 months, and given the fact that a number of companies are now openly gunning for Netflix, it will be interesting to see how the company performs going forward.

Source: Davemanuel.com NFLX Page


Most Recent Articles
Facebook (FB) Ticker - May 21st, 2012
Posted on: 2012-05-21 18:11:00
Facebook Drops 11% on Second Day of Trading
FB - Facebook - Day 1 - Chart
Posted on: 2012-05-18 17:10:00
Dud: Facebook Closes Just Above IPO Price
Photo of President Obama
Posted on: 2012-05-17 18:42:00
Barack Obama - Still Rich
Photo of President Obama from Obama.com
Posted on: 2012-05-15 16:42:00
Gallup: 56% of Americans Believe That Obama Will Win in November
Yahoo logo
Posted on: 2012-05-14 05:11:00
Scott Thompson Removed as CEO of Yahoo!


REVIEWS OF TOP ONLINE FOREX BROKERS

EtoroVisit
ForexyardVisit
QuestradeVisit


Twitter

316


ANSWERS

Which US Stocks Have the Largest Market Caps?

Is Trading Forex Easy or Hard?

When Will the Apple iPad Launch in Canada?

What is the Difference Between the Kindle DX and the Kindle 2?

What is a Credit Default Swap?

Which Holidays Result in US Markets Being Closed For The Day?

Why Do Stocks Get Halted?

What is the Difference Between Level 1, Level 2 and Level 3 Assets?


BLOG POSTINGS

The Ten Largest Monthly Deficits of the Past 30+ Years

Historical iPhone Sales Infographic

Who Are The Largest Holders of Facebook Stock?

Can Mitt Romney Win in 2012?

Weekly SuperPAC Update: Restore Our Future, Inc. and Winning Our Future Spend Over $10 Million Combined

Joe Biden, The Everyman (Financially Speaking)

How Much Debt Did the United States Have When Barack Obama Took Office?

Ron Paul's Portfolio: An Apocalyptic Vision of the Future

NHL Franchise Values Before and After the 2004-2005 Lockout

A Look at Barack Obama’s Investment Portfolio


POLITICAL NET WORTH

Rick Santorum Net Worth

Newt Gingrich Net Worth

Mitt Romney Net Worth

Ron Paul Net Worth

Joe Biden Net Worth

Barack Obama Net Worth


SUPERPACS

Endorse Liberty Inc

Winning Our Future

Restore Our Future, Inc.


MOST RECENT DICTIONARY ENTRIES

Broken IPO

Low Risk Investment

Distressed Sale

Fudge-it Budget

High Risk Investment

Appraisal

Rigged Markets

Accounts Payable

Net 30

Bad Debt


CREDIT CARDS AND OTHER SERVICES

The Top Three Online Stock Brokers In Canada

The Top Two Forex Brokers in Canada

Wall Street Journal Weekend Only Edition Subscription Discount


SPECIAL FEATURES

United States Debt Clock

Where Did The DJIA/NASDAQ/S&P 500 Trade On..

Historical GDP Numbers for the United States

US Government Spending Breakdown 1962-2015

History of Deficits and Surpluses in the U.S.

History of Debt In The United States

Historical Gold Prices

Largest Foreign Holders of US Debt

Inflation Calculator

Historical Unemployment Rates in the United States

Historical State Unemployment Rates

Canada Debt Clock

A History of Bank Failures in the United States

Dow Jones Historical Data

Nasdaq Historical Data

S&P 500 Historical Data

Compound Interest Calculator

Median Household Income History


ARTICLE ARCHIVES

Blog Posts

Company Reviews

Daytrading

General Knowledge

General Market News

Health + Fitness

Hedge Fund News

Internet Companies

Making Money Online

Motivational

Online Forex Trading

Real Estate News

Stock Market Education

Stock Market Scandals

The Economic Meltdown

Trader Profiles


DaveManuel.com - Copyright 2012, All Rights Reserved | Advertise | Privacy Policy | Disclaimer