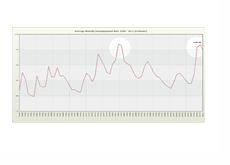
Average Monthly Unemployment Rate in 2010 was 9.64%
 The average monthly national unemployment rate in the United States in 2010 was 9.64%, the second highest total posted since the BLS started tracking and releasing unemployment data back in 1948.
 The number one spot still belongs to 1982, when the United States posted an average monthly unemployment rate of 9.71%.
The number three spot now belongs to 1983, when the country managed to post an average monthly national unemployment rate of 9.6%.
--
In 2010, the national unemployment rate never fell below 9.4% (December 2010) and never rose above 9.9% (April 2010). The "Great Recession" high in terms of the national unemployment rate came in October of 2009, when the country posted an unemployment rate of 10.2%.
While many economists believe that the economic fortunes of the country are starting to turn, there are not many who believe that the average monthly unemployment rate in 2011 will fall below 9%. While the gears of economic recovery are starting to turn in the country, it just doesn't appear that there will be a substantial downtick in the unemployment rate anytime soon. Even Federal Reserve Chairman Ben Bernanke believes that it will take "four to five more years for the job market to normalize fully."
Assuming that the average monthly unemployment rate in 2011 comes in at 9%, this would mean that the country will have posted an average rate of 9% for three straight years. This didn't happen in the early '80s, as the average monthly rate dipped to below 8% in 1984.
Here is a breakdown of the numbers, then and now:
1982 - 9.71%
1983 - 9.6%
1984 - 7.51%
2009 - 9.26%
2010 - 9.64%
2011 - 9.0% (estimate)

This would mean that the country posted an average monthly unemployment rate of 8.94% from 1982-1984, and an average monthly unemployment rate of 9.3% from 2009-2011.
So, while the highest single monthly unemployment rate on record (since the BLS started tracking data in 1948) belongs to 1982 (10.8%, November and December), and while the highest average monthly unemployment rate belongs to 1982 as well, the current unemployment rates in the country are set to stay in the stratosphere for a longer period of time.
in the early '80s, the United States had to deal with stagflation, which is a crippling mixture of weak economic activity and high inflation. The country was in dire straights at the time, but managed to fight back and shake off the effects of a nasty recession.
--
One more thing that I thought that you might be interested in seeing - the progression from 2000 to 2010 in terms of the average monthly national unemployment rate:
2000) 3.97%
2001) 4.74%
2002) 5.78%
2003) 5.99%
2004) 5.54%
2005) 5.08%
2006) 4.62%
2007) 4.63%
2008) 5.81%
2009) 9.26%
2010) 9.64%
If you hopped in a time machine and returned to the year 2000, I think that you would have a nearly impossible time convincing people that the national unemployment rate would be well north of 9% in just 10 years..
Filed under: The Economic Meltdown


