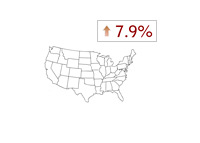
Unemployment Rate Ticks Up to 7.9% in January
 Earlier today, the BLS (Bureau of Labor Statistics) released the January Employment Situation Summary.
 According to the BLS, total nonfarm payroll employment increased by 157,000 in January, while the national unemployment rate ticked up to 7.9%.
These numbers were generally in line with expectations, as most economists had the US economy adding between 150k-170k jobs in January.
The markets were happy with the numbers, as the DJIA, Nasdaq and S&P 500 are all up at least 1% on the day.
--
Let's dig into the numbers a bit more.
The civilian labor force was 155,654,000 in January, up slightly from the month before (155,511,000). The civilian labor force consists of Americans who are at least 16 years of age that have a job or are looking for a job, and are not institutionalized or serving in the military.
The labor force participation rate was 63.6% in January, unchanged from the month before. To get the labor force participation rate, divide the civilian labor force by the civilian noninstitutional population (which was 244,663,000 in January). This leaves us with a number of 63.6%.
There were 143,322,000 employed Americans in January, up slightly from 143,305,000 the month before.
The number of unemployed Americans was slightly higher in January, rising from 12,206,000 to 12,332,000. Divide the total number of unemployed Americans (12,332,000) by the civilian labor force (155,654,000) and you are left with an unemployment rate of 7.9% (7.9227% to be exact).
The unemployment rate for adult men was 7.9% in January, while the unemployment rate for adult women was 7.3%.
The unemployment rates in January, broken down by ethnicity:
White - 7.0%
Black or African American - 13.8%
Asian - 6.5%
Hispanic or Latino - 9.7%
Unemployment rates by education:
Less than high school - 12.0%
High school graduates, no college - 8.1%
Some College - 7.0%
Bachelor's Degree - 3.7%
--
The U-6 unemployment rate, which is an alternative number that measures labor underutilization, was unchanged at 14.4% in January. This number includes:
-people who have given up looking for work (discouraged workers)
-people who have been forced to accept part-time jobs but want full-time work
-"marginally attached workers", who currently do not have a job but want full-time work and have looked for a job sometime in the past 12 months
--
Unemployment Rates Over the Last 12 Months:
February 2012 - 8.3%
March 2012 - 8.2%
April 2012 - 8.1%
May 2012 - 8.2%
June 2012 - 8.2%
July 2012 - 8.2%
August 2012 - 8.1%
September 2012 - 7.8%
October 2012 - 7.9%
November 2012 - 7.8%
December 2012 - 7.8%
January 2013 - 7.9%
Job Growth Over the Last 12 Months:
February 2012 - 259,000
March 2012 - 143,000
April 2012 - 68,000
May 2012 - 87,000
June 2012 - 45,000
July 2012 - 181,000
August 2012 - 192,000
September 2012 - 132,000
October 2012 - 137,000
November 2012 - 247,000
December 2012 - 196,000
January 2013 - 157,000
Source: BLS.gov
Source: Historical Unemployment Rates
Filed under: General Knowledge


