
Then it fell almost as fast as it rose. Claims dropped to 107,802 in 2025 and to about 35,000 in the first nine months of 2026, after Ottawa tightened the rules, first with visas and then with Bill C-12. The line of people waiting for a decision has been slower to shrink: 299,614 at the end of 2025.
This article sets out 46 years of UNHCR and Immigration and Refugee Board data, federal spending records and the rules on what claimants receive: how the numbers changed, what the system costs, how claimants' support compares with that of Canadians, and what the government is doing about the backlog.
Where the claims came from, what claimants receive, what the system costs Ottawa, and what the government is doing about the people still waiting.
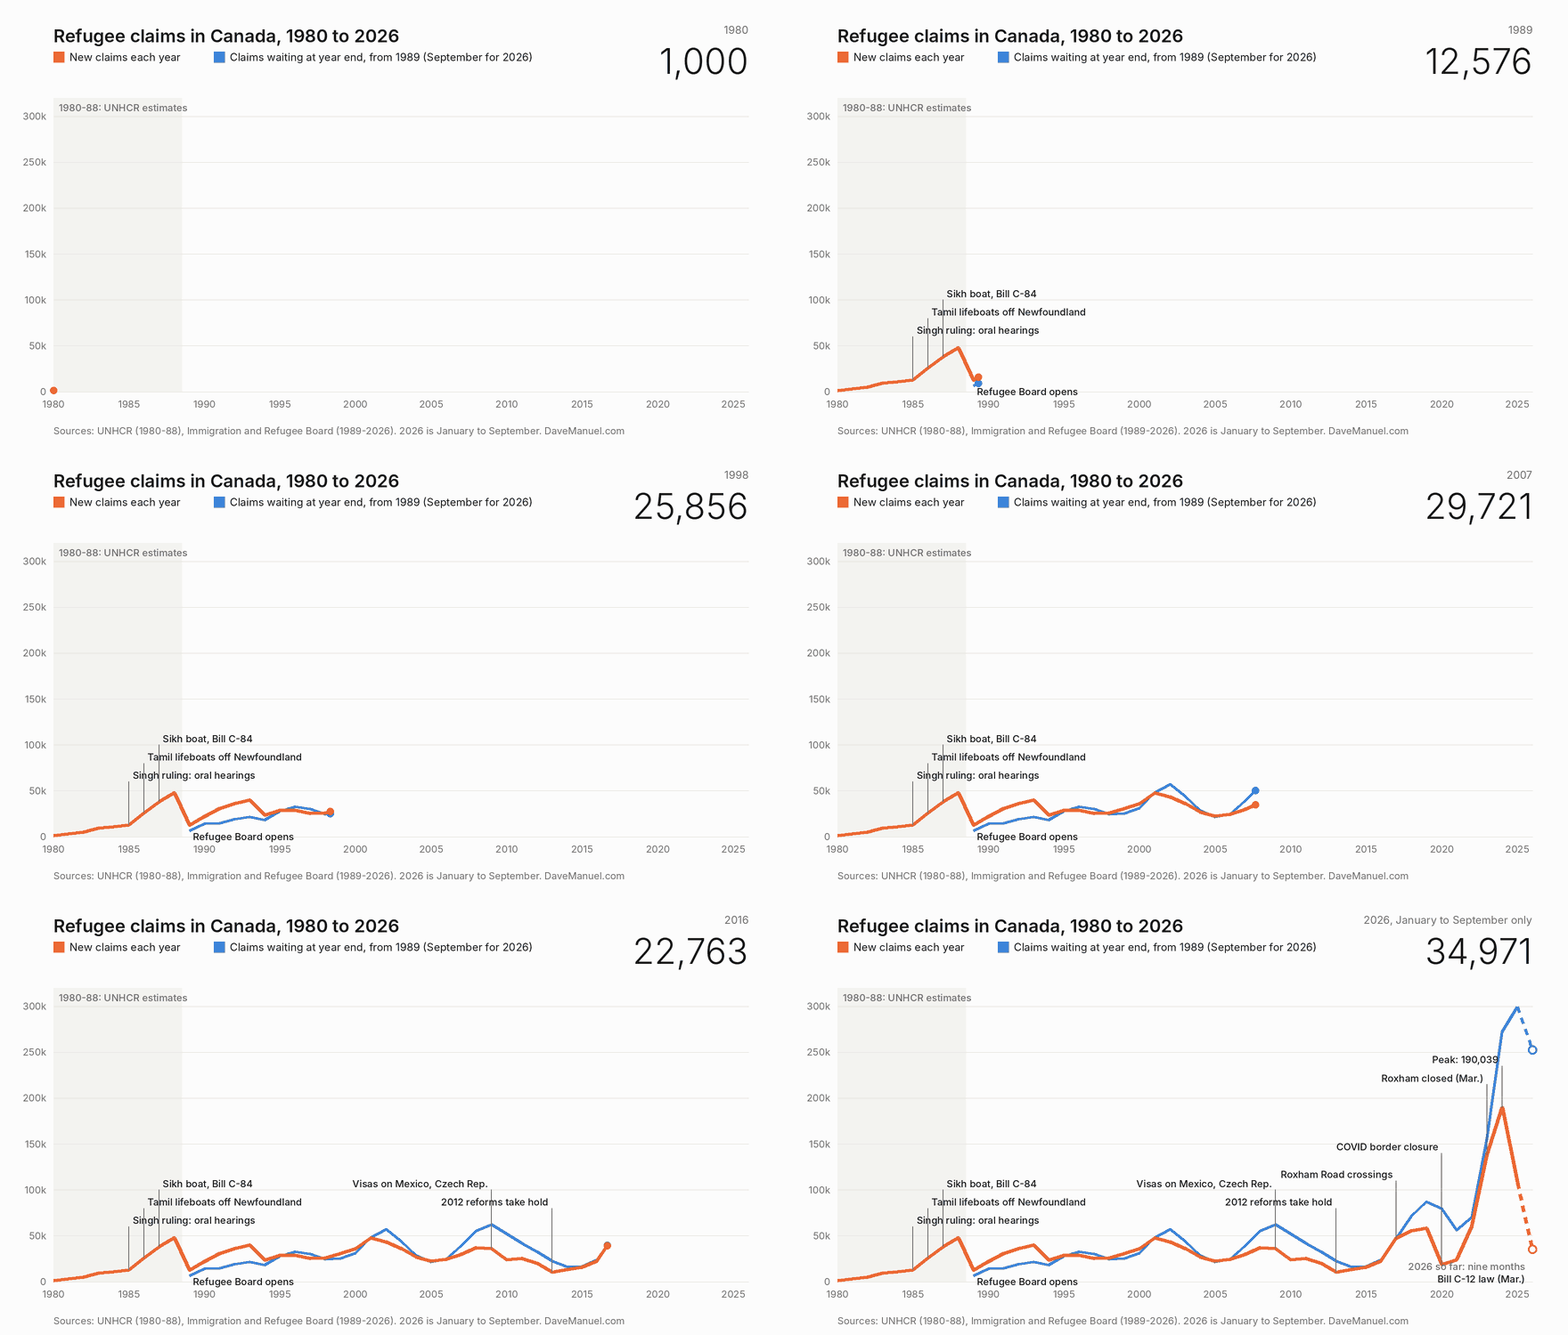
New refugee claims each year (orange) and claims waiting for a decision at year end (blue; September 30 for 2026). The figures for 1980 to 1988 are UNHCR estimates; the Immigration and Refugee Board's counts start in 1989. 2026 covers January to September only, shown dashed.
View the data table
| Year | Claims | Waiting at year end | Accepted | Source |
|---|---|---|---|---|
| 1980 | 1,000 | UNHCR estimate | ||
| 1981 | 3,000 | UNHCR estimate | ||
| 1982 | 5,000 | UNHCR estimate | ||
| 1983 | 9,400 | UNHCR estimate | ||
| 1984 | 11,000 | UNHCR estimate | ||
| 1985 | 13,000 | UNHCR estimate | ||
| 1986 | 26,000 | UNHCR estimate | ||
| 1987 | 38,000 | UNHCR estimate | ||
| 1988 | 48,000 | UNHCR estimate | ||
| 1989 | 12,576 | 6,561 | 86% | IRB, 2018 independent review |
| 1990 | 22,296 | 14,258 | 79% | IRB, 2018 independent review |
| 1991 | 30,546 | 14,580 | 72% | IRB, 2018 independent review |
| 1992 | 36,111 | 19,270 | 64% | IRB, 2018 independent review |
| 1993 | 39,845 | 21,694 | 55% | IRB, 2018 independent review |
| 1994 | 23,659 | 18,393 | 70% | IRB, 2018 independent review |
| 1995 | 28,714 | 28,044 | 71% | IRB, 2018 independent review |
| 1996 | 29,090 | 32,491 | 58% | IRB, 2018 independent review |
| 1997 | 25,281 | 30,239 | 53% | IRB, 2018 independent review |
| 1998 | 25,856 | 24,370 | 56% | IRB, 2018 independent review |
| 1999 | 30,955 | 25,655 | 58% | IRB, 2018 independent review |
| 2000 | 36,355 | 31,228 | 58% | IRB, 2018 independent review |
| 2001 | 47,823 | 48,258 | 58% | IRB, 2018 independent review |
| 2002 | 43,526 | 56,907 | 58% | IRB, 2018 independent review |
| 2003 | 36,171 | 43,773 | 50% | IRB, 2018 independent review |
| 2004 | 26,939 | 28,936 | 46% | IRB, 2018 independent review |
| 2005 | 22,492 | 21,737 | 50% | IRB, 2018 independent review |
| 2006 | 24,592 | 24,418 | 54% | IRB, 2018 independent review |
| 2007 | 29,721 | 38,972 | 53% | IRB, 2018 independent review |
| 2008 | 37,098 | 55,659 | 53% | IRB, 2018 independent review |
| 2009 | 35,949 | 62,446 | 53% | IRB, 2018 independent review |
| 2010 | 23,783 | 52,023 | 48% | IRB, 2018 independent review |
| 2011 | 25,406 | 42,149 | 45% | IRB, 2018 independent review |
| 2012 | 20,141 | 32,881 | 42% | IRB, 2018 independent review |
| 2013 | 10,227 | 22,544 | 44% | IRB, 2018 independent review |
| 2014 | 13,438 | 16,319 | 56% | IRB, 2018 independent review |
| 2015 | 15,961 | 16,806 | 68% | IRB, 2018 independent review |
| 2016 | 22,763 | 23,943 | 67% | IRB, 2018 independent review |
| 2017 | 47,425 | 47,209 | 66% | IRB, 2018 independent review |
| 2018 | 55,388 | 71,675 | 63% | IRB country tables |
| 2019 | 58,378 | 87,270 | 65% | IRB country tables |
| 2020 | 18,500 | 79,753 | 68% | IRB country tables |
| 2021 | 24,127 | 55,937 | 71% | IRB country tables |
| 2022 | 60,158 | 70,223 | 69% | IRB country tables |
| 2023 | 137,947 | 156,032 | 80% | IRB country tables |
| 2024 | 190,039 | 272,440 | 80% | IRB country tables |
| 2025 | 107,802 | 299,614 | 77% | IRB country tables |
| 2026* | 34,971 | 252,387 | 73% | IRB monthly reports, Jan-Sep |
*2026: January to September; waiting at September 30. Before 1989 there is no comparable pending count or acceptance rate.
01How We Got Here
From the early 1990s to 2016, the number of new claims moved between about 10,000 and 48,000 a year. Several of the sharpest rises and falls line up with changes in law or policy.
The Supreme Court's 1985 Singh decision effectively gave refugee claimants the right to an oral hearing, the decision that led Parliament to create the Immigration and Refugee Board. The visas imposed on Mexico and the Czech Republic in 2009 cut claims from both countries almost overnight. The 2012 reforms pushed the total down to 10,227 in 2013, the lowest year since the Board opened.
Irregular crossings at Roxham Road surged in 2017. COVID shut the border in 2020. When it reopened, claims went from 24,127 in 2021 to 60,158 in 2022, 137,947 in 2023 and 190,039 in 2024. Closing Roxham Road in March 2023 did not stop the climb. Mexico alone went from 250 claims in 2016 to 25,236 in 2023 before Ottawa brought back a visa for most Mexican travellers in February 2024.
Claims referred to the Immigration and Refugee Board; 1985 to 1987 are UNHCR estimates. *2026 is January to September.
02Where Claimants Come From
India was the most frequently listed country of alleged persecution in 2025, on 17,835 new claims, and had the lowest acceptance rate of the 15 biggest sources: 47% of the Indian claims the Board decided on the merits were accepted. More Indian claims were abandoned in 2025 (3,914) than accepted (2,040).
At the other end, claims from Iran were accepted about 99% of the time, China 93% and Nepal 92%. Across every country, 77% of the claims the Board decided in 2025 were accepted.
| Country | New claims, 2025 | Claims | Accepted | Waiting |
|---|---|---|---|---|
| India | 17,835 | 47% | 45,687 | |
| Haiti | 14,192 | 78% | 29,349 | |
| Iran | 7,114 | 99% | 11,448 | |
| Nigeria | 6,765 | 72% | 21,573 | |
| Mexico | 5,385 | 62% | 24,059 | |
| China | 4,489 | 93% | 7,224 | |
| Bangladesh | 4,070 | 58% | 20,099 | |
| Pakistan | 3,650 | 86% | 8,727 | |
| Ghana | 3,012 | 71% | 9,784 | |
| Sri Lanka | 2,663 | 86%+ | 12,627 | |
| Algeria | 2,251 | 85% | 5,821 | |
| Colombia | 2,094 | 80% | 8,704 | |
| Guinea | 1,997 | 71% | 4,709 | |
| DR Congo | 1,764 | 57% | 6,752 | |
| Nepal | 1,669 | 92% | 1,906 |
New claims referred to the Board in 2025, the share accepted among claims decided on the merits (abandoned and withdrawn claims are left out), and claims still waiting at December 31, 2025. Claims decided in 2025 are not necessarily claims filed in 2025. The Board suppresses small counts, so the rates for Iran and Sri Lanka are the lowest they could be: Iran is about 99%, Sri Lanka 86% or higher. The Board also does not publish the grounds of each claim, such as political opinion, religion or sexual orientation.
03What Claimants Receive
A refugee claimant who needs welfare gets the same provincial social assistance as a citizen in the same province. In Ontario that is $733 a month for a single adult, $343 for basic needs and up to $390 for shelter, whether you were born in Toronto or arrived last month.
| Ontario, single adult | A month | Health coverage |
|---|---|---|
| Refugee claimant on Ontario Works | $733 | Interim Federal Health Program: hospital and doctors free; pays $4 a prescription and 30% of eligible supplemental costs such as urgent dental, vision and counselling |
| Citizen on Ontario Works | $733 | OHIP, plus the Ontario Drug Benefit at up to $2 a prescription |
| Government-assisted refugee, first year only | $733 + transit | Plus a possible housing supplement if rent is higher than the shelter allowance, and a one-time start-up allowance of roughly $3,000 to $3,250 for furniture, clothing and household needs |
| Single senior aged 65 to 74 with no other income, eligible for full OAS and the maximum GIS and GAINS | $1,993 | OHIP; Old Age Security, the Guaranteed Income Supplement and Ontario's GAINS top-up |
Monthly amounts in Ontario in late 2026. Government-assisted refugees are resettled from abroad and are not refugee claimants; their support is tied to provincial welfare rates and ends after a year. Senior total: Old Age Security $762.50, Guaranteed Income Supplement $1,138.90 and GAINS $92, for October to December 2026.
The main difference is health coverage. Claimants are covered by the Interim Federal Health Program, which pays for things many working Canadians cover out of their own pocket, such as prescriptions, urgent dental care, glasses and counselling. Since May 1, 2026, claimants pay $4 a prescription and 30% of those extras. A citizen on Ontario Works pays up to $2 a prescription, so on prescriptions the claimant pays more.
A few other things claimants do not get: the Canada Child Benefit (until they are accepted as protected persons), Old Age Security (it requires 10 years of residence after age 18), or a federal hotel room. Ottawa closed the last of the hotels it had been renting for claimants on October 1, 2025.
A widely shared email saying a refugee gets $1,890 a month plus $580 in social assistance started with a 2004 Toronto Star story about a one-time start-up allowance that a reader took to be monthly. The Star's ombudsman set the record straight in November 2004, FactCheck.org debunked the American version in 2007, and Immigration, Refugees and Citizenship Canada still answers it on its own site: refugees do not get more financial help than Canadian pensioners.
04The Bill
Three federal lines that can be tracked year by year, refugee health care, the Immigration and Refugee Board and the grants Ottawa sends provinces and cities for shelter, added up to about $190 million in 2016-17. By 2024-25 they were $1.78 billion. That is neither the total cost of the asylum system nor spending only on claimants: it leaves out provincial and municipal costs, hotels and border enforcement, and the health program and the Board also serve other groups.
Interim Federal Health ProgramImmigration and Refugee Board (all divisions)Interim Housing Assistance Program grants (actual spending)Housing grants, allocations
Federal spending by fiscal year, in nominal dollars. Housing grants are allocations before 2022-23 (hatched) and actual spending from 2022-23; none were listed for 2021-22. The health program also covers resettled refugees, but claimants were about 71% of the people it served in 2024-25.
Refugee health care alone went from $74.3 million to $896.5 million, more than twelve times as much. The Parliamentary Budget Officer projected close to $1 billion for 2025-26, and the government expects the new co-payments to save about $140 million in their first year. Urgent dental care alone went from $30 million in 2019-20 to $257 million in 2024-25.
The chart leaves out some big numbers, because they do not run year by year:
- About $1.2 billion on federal hotel rooms for roughly 61,000 claimants between April 2020 and September 2025.
- A one-time payment of $581.3 million to Quebec in 2024-25, part of a $750 million package for its 2021 to 2024 asylum costs.
- What the provinces pay. Quebec alone paid $507.7 million in social assistance in 2024 to households with at least one asylum seeker.
Per person, the Budget Officer put the federal cost of an irregular border crosser's claim, from arrival to a final decision, at $14,321 for the 2017-18 group, and about $16,500 for a claimant from a visa-exempt country in 2024.
05The Backlog
Each pending claim belongs to someone living in Canada while they wait for a decision. The Board was funded for about 70,000 decisions in 2025-26 and 90,000 in 2026-27, against new referrals of 190,039 in 2024 and 107,802 in 2025.
The queue is now shrinking. In the first half of 2026 the Board finalized 49,960 claims while only 26,467 new ones came in, and by the end of September the queue was down to 252,387. Not all of that is decisions: 15,591 of those files were withdrawn or ended for other reasons, including claims the border agency found ineligible under the new rules.
Why claims fell in 2026. The drop lines up with a specific date. The Board took in 5,884 new referrals in March 2026. In April it took 2,662, and every month since has landed between about 2,600 and 3,000. Bill C-12 became law on March 26.
Claims referred to the Board each monthClaims the Board finalized each month
Immigration and Refugee Board monthly volume reports, September 2024 to September 2026. Referrals include a small number of reopened and returned cases.
The one-year bar shuts out anyone who makes a claim more than a year after first arriving in Canada, and the 14-day rule does the same for people who cross from the US between official crossings. Both reach back to claims made from June 3, 2025, the day the first version of the bill was introduced, so the decline had started before the law passed: referrals ran between about 7,400 and 11,800 a month through 2025, against 16,000 to 17,000 in the fall of 2024.
One caution on these numbers. The Board only counts claims that are referred to it. A claim the immigration department or the border agency finds ineligible never gets there; that person goes to a pre-removal risk assessment instead. So part of the drop is people who still made a claim and were diverted. The immigration department's own count of people making claims includes them, and it still shows 68% fewer claimants from January to August 2026 than in the same months of 2024.
| People making asylum claims, January to August | 2024 | 2025 | 2026 |
|---|---|---|---|
| Immigration, Refugees and Citizenship Canada count | 118,805 | 79,020 | 37,775 |
Sum of monthly claimant counts, January to August of each year, from IRCC asylum statistics (preliminary). This series counts people when they make a claim, including claims later found ineligible, so it is not the same as the Board's referrals.
The earlier decline in 2025 has several causes that no government source has split up: the visa Ottawa brought back for most Mexican travellers in February 2024, the push to cut the number of temporary residents in Canada, and the June 2025 bill itself.
Not all of the backlog is waiting on the Board, either. At the end of 2025, 182,800 claims were ready to be heard. Another 117,300 were incomplete, and 100,400 of those were waiting for the Canada Border Services Agency to finish its security screening.
Ready to be heard: 182,800Waiting on CBSA security screening: 100,400Other incomplete files: about 17,000
Each square is 1,000 claims pending at the Immigration and Refugee Board on December 31, 2025, from the Board's briefing to the House immigration committee on March 9, 2026. The Board rounds these figures; its total is about 300,100.
06Is Ottawa Planning an Amnesty?
No program that would grant status in bulk to people in the claims backlog has been announced or enacted. The measures passed since 2025 restrict who can have a claim heard.
Bill C-12, the Strengthening Canada's Immigration System and Borders Act, became law on March 26, 2026. For anyone who first entered Canada after June 24, 2020, a claim made more than a year after that arrival no longer goes to the Board, and neither does a claim from someone who crossed the US land border between official crossings and waited more than 14 days to make it. Both rules reach back to claims made on or after June 3, 2025. The immigration minister told the Senate that about 37% of the claims filed between June and October 2025 would be disallowed, and in April about 30,000 claimants were told they may not get a hearing. They get a pre-removal risk assessment instead, which the Canadian Council for Refugees says has accepted about 33% of applicants, against a five-year average of about 63% at the Board. Claims withdrawn or ended for other reasons, a category that includes claims ended because the border agency found the person ineligible, jumped to 15,591 in the first half of 2026, against 6,832 in all of 2025. Removals reached more than 23,000 in 2025, the most in the border agency's published series.
Two measures are sometimes described as an amnesty. Neither applies to claims still waiting for a decision.
- About 115,000 people moving to permanent residence. The 2026-2028 immigration levels plan includes a one-time initiative to move about 115,000 protected persons to permanent residence over 2026 and 2027. These are people who have already been found to be refugees and were waiting for permanent residence. People with claims still in the backlog are not part of it.
- Approvals on paper. Since at least 2019, the Board has accepted some straightforward claims on the file without a hearing. In 2025 that was about 11,900 claims, roughly 15% of all the claims it finalized. Critics, including Conservative MP Michelle Rempel Garner and James Yousif, a former immigration department policy director and former Board member, writing for the C.D. Howe Institute, say these claims are approved without enough questioning. The Board says security screening by the border agency has to be finished before any claim is decided, and that most files sent for paper review, about 60%, end up at a hearing anyway.
A regularization program for people living in Canada without status was discussed under the Trudeau government but was never created. It does not appear in the 2026-2028 immigration levels plan.
07About the Numbers
- Different series. Claims for 1980 to 1988 are UNHCR estimates of asylum applications in Canada. From 1989 the article uses the Immigration and Refugee Board's counts: claims received for 1989 to 2017, from the 2018 independent review of the Board, and claims referred for 2018 to 2025, from its annual country tables.
- Annual tables and monthly reports. The Board's annual country tables and its monthly operational reports count slightly differently; the monthly series also includes reopened and returned cases. That is why the country table shows 299,614 claims pending at the end of 2025 and the monthly series shows 299,855. Annual figures in this article come from the country tables, and the 2026 figures from the monthly series.
- 2026 is a partial year. 34,971 is the sum of monthly referrals from January to September 2026, and 252,387 is the pending count at September 30, 2026.
- Claims referred, not claims made. The Board only counts claims referred to it. Immigration, Refugees and Citizenship Canada counts people when they make a claim, which gives different totals: 171,840 claimants in 2024, for example.
- Acceptance rates are accepted claims divided by accepted plus rejected claims in the year, leaving out abandoned and withdrawn claims.