Dave Manuel Logo
Friday, November 20, 2009


FRONT PAGE
QUOTES
REVIEWS
ARTICLE ARCHIVE
NEWSLETTERS
DICTIONARY
TWITTER ALERTS
STOCK TWEETS
U.S. DEBT CLOCK
U.S. UNEMPLOYMENT
ADVERTISE
ARTICLE FEED
BLOG FEED


2008-10-11 19:38:30

How Have The Major North American Stock Market Indexes Performed Short-Term After Very Bad Years?


logos and arrow building up - dow jones industrial average - nasdaq composite - sp 500 index The Dow Jones Industrial Average, Nasdaq Composite and S+P 500 have all performed very well since their inceptions. Of the three indexes, the Dow Jones Industrial Average was the only one that existed during the Great Depression. The Nasdaq Composite was launched in 1971, and the S+P 500 was technically launched in 1957, though it is possible to extrapolate the data back in time due to the indexes listing requirements.

All three of these indexes are down 30-40% in 2008, which represents a historically awful years for all three indexes. Many people take comfort in the fact that the markets have always bounced back after bear markets, and that this time will be no different.

That may or may not be true - not be be too much of a downer, but a stock market index rebounding past its previous highs is not always necessarily a given. Just a couple of examples for you - the Nikkei 225 set an all-time high of around 39,000 in December of 1989, and has not come even close to matching those heights since. It currently sits at around 8,300 points. The Nasdaq Composite set an all-time high of over 5,000 in early 2000, and currently sits at 1,650 points over eight years later. You can't always count on the markets to bounce back, higher and stronger than ever, because it doesn't always happen.

Anyways, back to the DJIA, Nasdaq and S+P 500. I pulled all of the historical data from all three of the indexes. For the S+P 500, we will be using the extrapolated data that goes all the way back to 1928. For the Nasdaq, I will be going back to the mid 70s. A "very bad" year to me is a 20%+ down year.

Let's start with the S+P 500:

The S+P 500 was down 24.9% in 1930. The following year it lost an additional 43.4%. The year after that (1932), it lost an additional 8.2%.

The S+P 500 was down 35% in 1937, and rebounded strongly the very next year, closing up over 31%. It should be mentioned though, that the three following years were all down years for the index (-0.4%, -9.8% and -11.6%).

The S+P 500 was down 26.5% in 1974. 1975 saw a strong rebound, as the index traded up over 37.2%. 1976 was another strong year, with the S+P 500 adding an additional 23.9%.


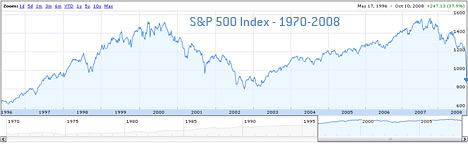
Since then, the S+P 500 has done extremely well, and has not had any "bad" years (not counting 2008 of course).

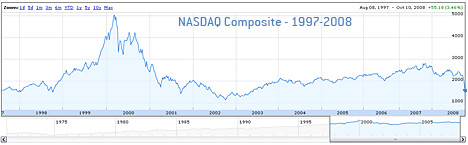
Now, the Nasdaq Composite:

Since 1975, the Nasdaq has had three "very bad" years - 2000, 2001 and 2002. 1990 was a weak year for the index as well, as it lost a total of 17.8%. The three years that followed saw gains of 56.84%, 15.45% and 14.75%.

2000 saw the types of losses that we will end up seeing in 2008, as the index lost a total of 39.29%. The next year saw a loss of 21.05%, while 2002 saw a loss of 31.53% as companies struggled with a 9-11 inspired recession.


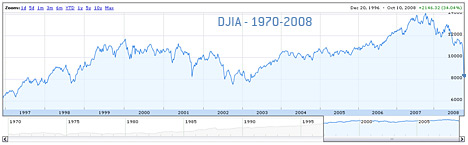
Now, the Dow Jones Industrial Average:

The Dow Jones Industrial Average fell 16.6% in 1973 and 27.5% in 1974. The next year (1975), the Dow Jones Industrial Average posted a very strong 38.3% return, followed by a 17.9% return the next year.

The DJIA fell 33.77% in 1930. Those hoping for a quick rebound were devastated after the DJIA posted a return of 52.67% the very next year, and a return of 23.07% in 1932.

The bottom line? Based on historical data, the REALLY bad years for the indexes tend to be followed by more losses, but this is not always the case. Those who are banking on an immediate turnaround may want to tread carefully over the next few years.


Filed under: The Economic Meltdown | Stock Market Education


COMMENTS

No comments yet.

Leave a comment

 Name (required)

 Your Website

Your Comment (required)


Most Recent Articles

Posted on: 2009-11-20 20:51:00
14.41% of All US Residential Mortgages Either Delinquent Or in Foreclosure
-- u.s. national debt clock --
Posted on: 2009-11-18 18:25:00
From Zero to $12 Trillion In 173 Years
-- goldman sachs skyrise --
Posted on: 2009-11-17 17:35:00
Goldman Sachs: "We Apologize"
-- no xmas parties at goldman sachs this year --
Posted on: 2009-11-15 17:27:00
Goldman Sachs Cancels Its Christmas Party For the Second Straight Year
-- growing debt of united states - graph - approacghing 12 trillion --
Posted on: 2009-11-14 16:44:00
United States National Debt Load About to Pass $12 Trillion Dollars


Subscribe to My RSS Feed


Click My Picture Above
To Subscribe To The RSS Feed


Twitter

255


Dow Jones10318.16-14.28-0.14%
Nasdaq2146.04-10.78-0.5%
S&P 5001091.38-3.52-0.32%


BLOG POSTINGS

More Arrests Made in Galleon Group Insider Trading Case

CNBC Viewership Numbers Are Trending Downwards

Amazon.com Surges to New All-Time High After Q3 Earnings

A Record Number of Foreclosure Filings In Q3 2009

Bernard Madoff Reportedly Gets Into a Fight in Prison

Spot Gold Price Hits New All Time High

Is the World Bank Running Out of Money?

Cramer Slammed For Ill-Timed CIT Call

US Income Gap Continues to Widen

Over 35 Million Americans Receiving Food Stamps


TOP FIVE MOST POPULAR ARTICLES

The Top Ten Most Outrageous Stock Market Scams of all Time

The Top Twelve Stock Market Scams of the Last Twelve Years

The Real Unemployment Rate Is Much Worse Than 8.1%

The Seven Most Crooked CEOs of All Time

Think that the SEC Is Corrupt? Meet Gary Aguirre


REVIEWS

Questrade Reviews


MOST RECENT DICTIONARY ENTRIES

Market Correction

OPEC

Stop Loss

Form 8-K

Black Friday

Zombie Bank

Consensus Estimate

Chinese Wall

Front Running

T.2 Trading Halt Code


CREDIT CARDS AND OTHER SERVICES

The Top Three Online Stock Brokers In Canada

Free Real-Time Stock Quotes: Some Of The Best Resources

FreeCreditReport.com Review - The Facts Revealed

Questrade Review

Jim Cramer Action Alerts Plus Review

0% Balance Transfer Credit Card Offers - Do They Exist?

The American Express Platinum Credit Card

Direct Access Brokers: The Best of the Best

Discover More Card Review

American Express Platinum Credit Card Review

Discover Student Card Review

American Express Gold Card Review

American Express Delta Skymiles Card Review

The Best Reward Credit Cards

Questrade Promotional Code - Qualifying for Your Free Commissions

Optionshouse Review

Hulbert Interactive Review

Marketwatch Options Trader Newsletter Review

Retirement Weekly Newsletter Review

The Three Most Prestigious Credit Cards In the World

Barron's Online Review

Retirement Newsletters: Which One Is the Best?

Thestreet.com RealMoney Review

Proactive Fund Investor Newsletter Review

The Best Online Brokerage in Canada (In My Opinion)

Wall Street Journal Subscription - Up to 80% Off Regular Price


PROMOTIONS AND OFFERS

Hercule Poirot DVD Reviews

Platinum Card Application Form

Gold Card Application Form

Free Payday Loan Quotes

Optionshouse Promotion Code - Qualifying For Your Free 100 Trades


FOREX

How to Become a Great Forex Trader

Who Offers Automated Forex Trading?

Forex Broker Reviews

Two of the Best Online Forex Brokers in the World

The Top Two Forex Brokers in Canada


SPECIAL FEATURES

United States Debt Clock

History of Deficits and Surpluses in the U.S.

Inflation Calculator

Historical Unemployment Rates in the United States

Canada Debt Clock

UK National Debt Clock

A History of Bank Failures in the United States

Mortgage Refinancing Calculator

Dow Jones Historical Data

Nasdaq Historical Data

S&P 500 Historical Data

Stock Market Guru Twitter Alerts

Historical Gold Prices


OTHER

Mortgage Refinancing

Home Equity Loans


MARKET INFORMATION

Top Nasdaq Gainers by Percentage

Top NYSE Gainers by Percentage


ARTICLE ARCHIVES

Blog Posts

Company Reviews

Daytrading

General Knowledge

General Market News

Health + Fitness

Hedge Fund News

Internet Companies

Making Money Online

Motivational

Online Forex Trading

Real Estate News

Stock Market Education

Stock Market Scandals

The Economic Meltdown

Trader Profiles


DaveManuel.com - Copyright 2009, All Rights Reserved | Advertise | Privacy Policy | Disclaimer