Dave Manuel Logo
Monday, May 21, 2012
Click Here to Subscribe to My Free Newsletter

DaveManuel.com BLOG POSTS
FRONT PAGE
SEARCH
INSIDER FILINGS
CONTACT ME
SPECIAL FEATURES
NEWSLETTERS
INTERNATIONAL
REFINANCING
TRADING ACADEMY
ARTICLE ARCHIVE
BLOG POSTS
DICTIONARY
U.S. DEBT CLOCK
SUPERPAC SPENDING
U.S. UNEMPLOYMENT
ANSWERS
INFOGRAPHICS
PERSONAL FINANCE
REVIEWS
NEWSLETTER
ADVERTISE
ARTICLE FEED
BLOG FEED


2011-08-08 17:52:00

Markets Plunge After S&P Downgrade


S&P 500 drop - Aug 08th, 2011 As expected, the markets were destroyed today after Standard and Poor's announced a downgrade of America's credit rating after the closing bell on Friday.

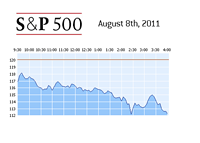
There were a number of headfakes throughout the day (the DJIA rallied a couple of hundred points during the last hour of trading, only to tank to new daily lows during the last few minutes), but the final damage ended up looking like this:

DJIA, -634.76, -5.55%
NASDAQ, -174.72, -6.90%
S+P 500, -79.92, -6.66%

An awful, awful day for the markets. The three averages listed above have basically gone straight down since the debt ceiling deal was announced last week.

--

So how bad was today from a historical perspective? Let's take a look:

For the DJIA, today was the sixth worst day in the history of the average in terms of total point loss:

1. 2008-09-29 -777.68 points
2. 2008-10-15 -733.08 points
3. 2001-09-17 -684.81 points
4. 2008-12-01 -679.95 points
5. 2008-10-09 -678.91 points
6. 2011-08-08 -634.76 points

In terms of total % loss, today wasn't even in the top ten (the worst day ever was 1987-10-19 when the DJIA dropped a whopping 22.61%).

For the NASDAQ, today wasn't in the top ten in terms of point loss (April 14th, 2000 holds the record with a drop of 355.49 points) or percentage loss (October 19th, 1987, -11.35%).

For the S&P 500, today was the 5th largest point drop in the history of the index:

1. 2008-09-29 -106.85 points
2. 2008-10-15 -90.17 points
3. 2000-04-14 -83.95 points
4. 2008-12-01 -80.03 points
5. 2011-08-08 -79.92 points

In terms of total percentage loss, today was just outside of the top 10:

1. 1987-10-19 -20.47%
2. 2008-10-15 -9.03%
3. 2008-12-01 -8.93%
4. 2008-09-29 -8.81%
5. 1987-10-26 -8.28%
6. 2008-10-09 -7.62%
7. 1997-10-27 -6.87%
8. 1998-08-31 -6.80%
9. 1988-01-08 -6.77%
10. 2008-11-20 -6.71%

--

It's going to be interesting to see how the markets react tomorrow. After all, Wall Street's horrible performance today will be all over the nightly news and on the front of the morning papers tomorrow. Many people that I talk to seem to be of the "sell now, ask questions later" mindset..

Source: Dow Jones Historical Data

S&P 500 Historical Data

Nasdaq Historical Data


Filed under: The Economic Meltdown


COMMENTS - What Say You?

No comments yet.

Leave a Reply

Name:


Web Site:


Your Comment:


Related Articles
FB - Facebook - Day 1 - Chart
Posted on: 2012-05-18 17:10:00
Dud: Facebook Closes Just Above IPO Price
Worker Subtracted - Illustration
Posted on: 2012-05-04 15:46:00
April Jobs Report: 115,000 Jobs Added, Unemployment Rate Falls to 8.1%
Stock Market on the Rise - Illustration
Posted on: 2012-03-17 12:53:00
Good Times: Insider Stock Sales at Highest Levels Since December 2009
Dow Jones Industrial Average - 5 Year Chart - February 5th, 2012
Posted on: 2012-02-06 00:11:00
What Economic Collapse? Dow Hits Highest Levels Since May of 2008
Santa Claus looking sideways
Posted on: 2011-12-17 22:52:00
Where's The Santa Claus Rally?


REVIEWS OF TOP ONLINE FOREX BROKERS

EtoroVisit
ForexyardVisit
QuestradeVisit


Twitter

316


SPECIAL FEATURES

Debt Ceiling Changes (1940-Present)

United States Debt Clock

Where Did The DJIA/NASDAQ/S&P 500 Trade On..

Historical GDP Numbers for the United States

US Government Spending Breakdown 1962-2015

History of Deficits and Surpluses in the U.S.

History of Debt In The United States

Largest Foreign Holders of US Debt

Inflation Calculator

Historical Unemployment Rates in the United States

Historical State Unemployment Rates

Canada Debt Clock

A History of Bank Failures in the United States

Dow Jones Historical Data

Nasdaq Historical Data

S&P 500 Historical Data

Median Household Income History

Compound Interest Calculator

List of Failed US Banks 2000-Present


BLOG POSTINGS

The Ten Largest Monthly Deficits of the Past 30+ Years

Historical iPhone Sales Infographic

Who Are The Largest Holders of Facebook Stock?

Can Mitt Romney Win in 2012?

Weekly SuperPAC Update: Restore Our Future, Inc. and Winning Our Future Spend Over $10 Million Combined

Joe Biden, The Everyman (Financially Speaking)

How Much Debt Did the United States Have When Barack Obama Took Office?

Ron Paul's Portfolio: An Apocalyptic Vision of the Future

NHL Franchise Values Before and After the 2004-2005 Lockout

A Look at Barack Obama’s Investment Portfolio


POLITICAL NET WORTH

Rick Santorum Net Worth

Newt Gingrich Net Worth

Mitt Romney Net Worth

Ron Paul Net Worth

Joe Biden Net Worth

Barack Obama Net Worth


SUPERPACS

Endorse Liberty Inc

Winning Our Future

Restore Our Future, Inc.


MOST RECENT DICTIONARY ENTRIES

Low Risk Investment

Distressed Sale

Fudge-it Budget

High Risk Investment

Appraisal

Rigged Markets

Accounts Payable

Net 30

Bad Debt

Accounts Receivable


CREDIT CARDS AND OTHER SERVICES

The Top Three Online Stock Brokers In Canada

The Top Two Forex Brokers in Canada

Wall Street Journal Weekend Only Edition Subscription Discount


ARTICLE ARCHIVES

Blog Posts

Company Reviews

Daytrading

General Knowledge

General Market News

Health + Fitness

Hedge Fund News

Internet Companies

Making Money Online

Motivational

Online Forex Trading

Real Estate News

Stock Market Education

Stock Market Scandals

The Economic Meltdown

Trader Profiles


DaveManuel.com - Copyright 2012, All Rights Reserved | Advertise | Privacy Policy | Disclaimer