Highest Unemployment Rate Since April of 1983
 Wow - I'm not sure if anyone was expecting a 10.2% unemployment number for the month of October.
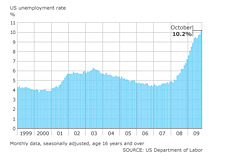
Most economists that were surveyed were predicting a slight uptick in the national unemployment number to 9.9% (from 9.8% in September).
Some were predicting 10%, while a few more were on the record as expecting 10.1%.
But 10.2%? I didn't hear anyone calling for such an increase before the October numbers were released.
The last time that we experienced double-digit unemployment in the United States was June of 1983. The national unemployment rate was 10.1% in June of '83, and dipped to 9.4% the month after.
Two years ago, the unemployment rate in the United States was 4.8% (October of 2007). So, in less than 2 years, the unemployment rate has increased 5.4%.
A few other notes from the Bureau of Labor Statistics report:
-190k job losses in October
-most of these losses were concentrated in construction, manufacturing and retail
-unemployment rate for adult men was 10.7%
-U-6 unemployment rate (which measures overall labor underutilization) comes in at a whopping 17.5% in October
These numbers certainly won't help the mindset of the average American heading into the crucial holiday shopping season.
The American economy may technically be back into growth mode, but the October unemployment number certainly won't do much to inspire the confidence of the average American in their economy.
Source: BLS.gov - Employment Situation Summary
Historical Unemployment Rates in the United States
Filed under: The Economic Meltdown


