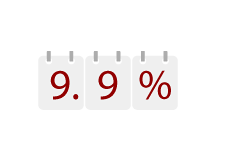
April Unemployment Number Comes in 0.2% Higher Than Expected
 The national unemployment rate clocked in at 9.9% in April, further adding to the doom and gloom that is currently permeating Wall Street.
 The general consensus was that April's unemployment rate would come in at 9.7%, which would have ended up being the fourth straight month at that number. This wasn't meant to be, as the Bureau of Labor Statistics revealed that the unemployment number was 0.2% higher than the consensus of 9.7%.
This higher than expected unemployment number just further added to the misery of the past week on Wall Street. An ongoing debt crisis in the European Union, an intraday drop of 1,000 points on the DJIA and now this? It wasn't a good week for Wall Street.
Many people were hoping that the unemployment number would continue to stabilize this month, and perhaps even drop. As mentioned, the unemployment rate was 9.7% in January, February and March, and most people were expecting more of the same in April.
April's unemployment number was the fourth highest since the start of the "Great Recession" in December of 2007, behind Oct/09 (10.2%), Nov/09 (10.0%) and Dec/09 (10.0%).
According to the BLS (Bureau of Labor Statistics), the number of unemployed persons in April was 15.3 million.
In addition, the number of long-term unemployed (those without a job for 27 weeks or more) continued to trend higher in April, hitting a total of 6.7 million. A particularly sobering figure - 45.9% of unemployed people have been jobless for 27 weeks or more.
The U-6 unemployment rate, which is used to measure labor underutilization, also increased in April, ticking higher to 17.1% from 16.9% in March. The U-6 unemployment rate includes a number of key groups that the U-3 rate (which is the "official" rate) excludes, including: marginally attached workers, discouraged workers (which are considered to be a subset of the marginally attached workers) and those who have accepted part-time work for economic reasons. For a definition of these terms, please visit our U-6 unemployment definition page.
Speaking of discouraged workers, there were 1.2 million discouraged workers in April of 2010. Discouraged workers, in case you didn't click through to the definition page above, are those people who have completely given up on finding work because they truly believe that there are no jobs available to them. These "discouraged workers", it should be mentioned, are not included in the official unemployment numbers.
The last time that the national unemployment rate was over 10% (not including the end of 2009) was in late 1982, when the rate hit a high of 10.8%. At the time, the country was sick with a bad case of stagflation (high inflation and weak economic activity). For some historical perspective, it took the US approximately 4 years to comfortably drop below the 7% mark after hitting a high of 10.8% in November of 1982. Based on these numbers, we wouldn't drop below 7% until October of 2013.
The $64,000 at that point still remains - which industries will end up employing the millions upon millions of jobless Americans who are currently sitting on the sidelines?
Source: Historical Unemployment Rates in the United States
Filed under: The Economic Meltdown


