The Growth of US Military Spending Over the Years
 The OMB (Office of Management and Budget) has a page on their site that is devoted to the publishing of historical data (link below). There is all sorts of data published on the site - total government expenditures over the years, GDP over the years, etc.
 For this article, we are going to be looking at two tables of data:
Table 4.1 - Outlays by Agency (1962-2015)
Table 4.2 - Percentage Distribution of Outlays by Agency (1962-2015)
What do they two tables tell us?
Well, they show how much each agency in the government (such as Labor, Commerce, etc) spent per year from 1962 until present day, and they also show us each agency's spending at a total % of agency outlays. This can reveal interesting trends over the years.
For this article, we are going to focus on the country's Military spending from 1962 until 2010. In addition, we'll also include the government's projections for military spending from 2011 to 2015.
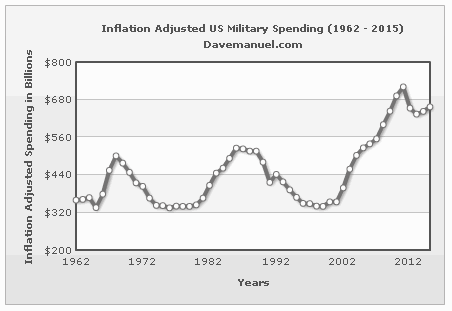
We will list four pieces of data (in regards to military spending) from 1962-2010 - Total Military Spending, Total Agency Outlays, Military Spending as % of Agency Outlays, Inflation Adjusted Military Spending. We will also include projections from 2011 to 2015.

Year: 1962
Military Spending: $50,111,000,000
Total Agency Outlays: $106,821,000,000
Military Spending vs Total Agency Outlays: 46.91%
Inflation Adjusted Military Spending: $359,797,000,000
Year: 1963
Military Spending: $51,147,000,000
Total Agency Outlays: $111,316,000,000
Military Spending vs Total Agency Outlays: 45.95%
Inflation Adjusted Military Spending: $362,121,000,000
Year: 1964
Military Spending: $52,585,000,000
Total Agency Outlays: $118,528,000,000
Military Spending vs Total Agency Outlays: 44.37%
Inflation Adjusted Military Spending: $367,569,000,000
Year: 1965
Military Spending: $48,780,000,000
Total Agency Outlays: $118,228,000,000
Military Spending vs Total Agency Outlays: 41.26%
Inflation Adjusted Military Spending: $335,606,000,000
Year: 1966
Military Spending: $56,629,000,000
Total Agency Outlays: $134,532,000,000
Military Spending vs Total Agency Outlays: 42.09%
Inflation Adjusted Military Spending: $378,848,000,000
Year: 1967
Military Spending: $70,069,000,000
Total Agency Outlays: $157,464,000,000
Military Spending vs Total Agency Outlays: 44.50%
Inflation Adjusted Military Spending: $454,748,000,000
Year: 1968
Military Spending: $80,355,000,000
Total Agency Outlays: $178,134,000,000
Military Spending vs Total Agency Outlays: 45.11%
Inflation Adjusted Military Spending: $500,612,000,000
Year: 1969
Military Spending: $80,771,000,000
Total Agency Outlays: $183,640,000,000
Military Spending vs Total Agency Outlays: 43.98%
Inflation Adjusted Military Spending: $477,357,000,000
Year: 1970
Military Spending: $80,123,000,000
Total Agency Outlays: $195,649,000,000
Military Spending vs Total Agency Outlays: 40.95%
Inflation Adjusted Military Spending: $447,888,000,000
Year: 1971
Military Spending: $77,497,000,000
Total Agency Outlays: $210,172,000,000
Military Spending vs Total Agency Outlays: 36.87%
Inflation Adjusted Military Spending: $414,609,000,000
Year: 1972
Military Spending: $77,645,000,000
Total Agency Outlays: $230,681,000,000
Military Spending vs Total Agency Outlays: 33.66%
Inflation Adjusted Military Spending: $402,978,000,000
Year: 1973
Military Spending: $75,033,000,000
Total Agency Outlays: $245,707,000,000
Military Spending vs Total Agency Outlays: 30.54%
Inflation Adjusted Military Spending: $366,161,000,000
Year: 1974
Military Spending: $77,864,000,000
Total Agency Outlays: $269,359,000,000
Military Spending vs Total Agency Outlays: 28.91%
Inflation Adjusted Military Spending: $342,602,000,000
Year: 1975
Military Spending: $84,852,000,000
Total Agency Outlays: $332,332,000,000
Military Spending vs Total Agency Outlays: 25.53%
Inflation Adjusted Military Spending: $341,954,000,000
Year: 1976
Military Spending: $87,917,000,000
Total Agency Outlays: $371,792,000,000
Military Spending vs Total Agency Outlays: 23.65%
Inflation Adjusted Military Spending: $334,964,000,000
Year: 1977
Military Spending: $95,147,000,000
Total Agency Outlays: $409,218,000,000
Military Spending vs Total Agency Outlays: 23.25%
Inflation Adjusted Military Spending: $340,626,000,000
Year: 1978
Military Spending: $102,259,000,000
Total Agency Outlays: $458,746,000,000
Military Spending vs Total Agency Outlays: 22.29%
Inflation Adjusted Military Spending: $339,500,000,000
Year: 1979
Military Spending: $113,605,000,000
Total Agency Outlays: $504,028,000,000
Military Spending vs Total Agency Outlays: 22.54%
Inflation Adjusted Military Spending: $339,679,000,000
Year: 1980
Military Spending: $130,912,000,000
Total Agency Outlays: $590,941,000,000
Military Spending vs Total Agency Outlays: 22.15%
Inflation Adjusted Military Spending: $344,299,000,000
Year: 1981
Military Spending: $153,861,000,000
Total Agency Outlays: $678,241,000,000
Military Spending vs Total Agency Outlays: 22.69%
Inflation Adjusted Military Spending: $366,189,000,000
Year: 1982
Military Spending: $180,693,000,000
Total Agency Outlays: $745,743,000,000
Military Spending vs Total Agency Outlays: 24.23%
Inflation Adjusted Military Spending: $406,559,000,000
Year: 1983
Military Spending: $204,356,000,000
Total Agency Outlays: $808,364,000,000
Military Spending vs Total Agency Outlays: 25.28%
Inflation Adjusted Military Spending: $445,496,000,000
Year: 1984
Military Spending: $220,863,000,000
Total Agency Outlays: $851,805,000,000
Military Spending vs Total Agency Outlays: 25.93%
Inflation Adjusted Military Spending: $461,604,000,000
Year: 1985
Military Spending: $245,109,000,000
Total Agency Outlays: $946,344,000,000
Military Spending vs Total Agency Outlays: 25.90%
Inflation Adjusted Military Spending: $492,669,000,000
Year: 1986
Military Spending: $265,440,000,000
Total Agency Outlays: $990,382,000,000
Military Spending vs Total Agency Outlays: 26.80%
Inflation Adjusted Military Spending: $525,571,000,000
Year: 1987
Military Spending: $273,919,000,000
Total Agency Outlays: $1,004,017,000,000
Military Spending vs Total Agency Outlays: 27.28%
Inflation Adjusted Military Spending: $523,185,000,000
Year: 1988
Military Spending: $281,889,000,000
Total Agency Outlays: $1,064,416,000,000
Military Spending vs Total Agency Outlays: 26.48%
Inflation Adjusted Military Spending: $515,857,000,000
Year: 1989
Military Spending: $294,829,000,000
Total Agency Outlays: $1,143,744,000,000
Military Spending vs Total Agency Outlays: 25.78%
Inflation Adjusted Military Spending: $515,951,000,000
Year: 1990
Military Spending: $289,694,000,000
Total Agency Outlays: $1,253,007,000,000
Military Spending vs Total Agency Outlays: 23.12%
Inflation Adjusted Military Spending: $480,892,000,000
Year: 1991
Military Spending: $261,860,000,000
Total Agency Outlays: $1,324,234,000,000
Military Spending vs Total Agency Outlays: 19.77%
Inflation Adjusted Military Spending: $416,357,000,000
Year: 1992
Military Spending: $286,574,000,000
Total Agency Outlays: $1,381,543,000,000
Military Spending vs Total Agency Outlays: 20.74%
Inflation Adjusted Military Spending: $441,324,000,000
Year: 1993
Military Spending: $278,510,000,000
Total Agency Outlays: $1,409,392,000,000
Military Spending vs Total Agency Outlays: 19.76%
Inflation Adjusted Military Spending: $417,765,000,000
Year: 1994
Military Spending: $268,577,000,000
Total Agency Outlays: $1,461,766,000,000
Military Spending vs Total Agency Outlays: 18.37%
Inflation Adjusted Military Spending: $392,122,000,000
Year: 1995
Military Spending: $259,487,000,000
Total Agency Outlays: $1,515,753,000,000
Military Spending vs Total Agency Outlays: 17.12%
Inflation Adjusted Military Spending: $368,472,000,000
Year: 1996
Military Spending: $253,196,000,000
Total Agency Outlays: $1,560,486,000,000
Military Spending vs Total Agency Outlays: 16.23%
Inflation Adjusted Military Spending: $349,410,000,000
Year: 1997
Military Spending: $258,262,000,000
Total Agency Outlays: $1,601,124,000,000
Military Spending vs Total Agency Outlays: 16.13%
Inflation Adjusted Military Spending: $348,654,000,000
Year: 1998
Military Spending: $255,793,000,000
Total Agency Outlays: $1,652,463,000,000
Military Spending vs Total Agency Outlays: 15.48%
Inflation Adjusted Military Spending: $340,205,000,000
Year: 1999
Military Spending: $261,196,000,000
Total Agency Outlays: $1,701,849,000,000
Military Spending vs Total Agency Outlays: 15.35%
Inflation Adjusted Military Spending: $339,555,000,000
Year: 2000
Military Spending: $281,028,000,000
Total Agency Outlays: $1,788,957,000,000
Military Spending vs Total Agency Outlays: 15.71%
Inflation Adjusted Military Spending: $354,095,000,000
Year: 2001
Military Spending: $290,185,000,000
Total Agency Outlays: $1,862,906,000,000
Military Spending vs Total Agency Outlays: 15.58%
Inflation Adjusted Military Spending: $354,026,000,000
Year: 2002
Military Spending: $331,845,000,000
Total Agency Outlays: $2,010,907,000,000
Military Spending vs Total Agency Outlays: 16.50%
Inflation Adjusted Military Spending: $398,214,000,000
Year: 2003
Military Spending: $388,686,000,000
Total Agency Outlays: $2,159,906,000,000
Military Spending vs Total Agency Outlays: 18.00%
Inflation Adjusted Military Spending: $458,649,000,000
Year: 2004
Military Spending: $437,034,000,000
Total Agency Outlays: $2,292,853,000,000
Military Spending vs Total Agency Outlays: 19.06%
Inflation Adjusted Military Spending: $502,589,000,000
Year: 2005
Military Spending: $474,354,000,000
Total Agency Outlays: $2,471,971,000,000
Military Spending vs Total Agency Outlays: 19.19%
Inflation Adjusted Military Spending: $526,533,000,000
Year: 2006
Military Spending: $499,344,000,000
Total Agency Outlays: $2,655,057,000,000
Military Spending vs Total Agency Outlays: 18.81%
Inflation Adjusted Military Spending: $539,292,000,000
Year: 2007
Military Spending: $528,578,000,000
Total Agency Outlays: $2,728,702,000,000
Military Spending vs Total Agency Outlays: 19.37%
Inflation Adjusted Military Spending: $555,007,000,000
Year: 2008
Military Spending: $594,662,000,000
Total Agency Outlays: $2,982,554,000,000
Military Spending vs Total Agency Outlays: 19.94%
Inflation Adjusted Military Spending: $600,609,000,000
Year: 2009
Military Spending: $636,775,000,000
Total Agency Outlays: $3,517,681,000,000
Military Spending vs Total Agency Outlays: 18.10%
Inflation Adjusted Military Spending: $643,143,000,000
Year: 2010
Military Spending: $692,031,000,000
Total Agency Outlays: $3,720,701,000,000
Military Spending vs Total Agency Outlays: 18.60%
Inflation Adjusted Military Spending: $692,031,000,000
Year: 2011
Military Spending: $721,285,000,000
Total Agency Outlays: $3,833,861,000,000
Military Spending vs Total Agency Outlays: 18.81%
Inflation Adjusted Military Spending: $721,285,000,000
Year: 2012
Military Spending: $653,424,000,000
Total Agency Outlays: $3,754,852,000,000
Military Spending vs Total Agency Outlays: 17.40%
Inflation Adjusted Military Spending: $653,424,000,000
Year: 2013
Military Spending: $633,918,000,000
Total Agency Outlays: $3,915,443,000,000
Military Spending vs Total Agency Outlays: 16.19%
Inflation Adjusted Military Spending: $633,918,000,000
Year: 2014
Military Spending: $642,903,000,000
Total Agency Outlays: $4,161,230,000,000
Military Spending vs Total Agency Outlays: 15.45%
Inflation Adjusted Military Spending: $642,903,000,000
Year: 2015
Military Spending: $657,336,000,000
Total Agency Outlays: $4,385,531,000,000
Military Spending vs Total Agency Outlays: 14.99%
Inflation Adjusted Military Spending: $657,336,000,000
As you can see, military spending was nearly 47% of agency outlays in 1962. This figure has slowly declined over the years, and was 18.6% in 2010.
This isn't due to military spending decreasing - instead, spending at other agencies has increased dramatically over the past 40-50 years. For instance, spending on Health and Human Services was just 3.3% of total agency outlays in 1962, and 23.3% in 2010.
As you can see from the data above, US military spending rapidly increased after 2001, roughly doubling (in inflation adjusted dollars) in just a decade.
According to Wikipedia, here is a breakdown of US military expenditure for 2010:
Operations and Maintenance - $283.3 billion
Military Personnel - $154.2 billion
Procurement - $140.1 billion
Research, Development, Testing & Evaluation - $79.1 billion
Military Construction - $23.9 billion
Family Housing - $3.1 billion
By service:
Army - $225.2 billion
Navy/Marine Corps - $171.7 billion
Air Force - $160.5 billion
Defense Wide - $106.4 billion
Source: Office of Management and Budget - Historical Tables
Filed under: General Knowledge


