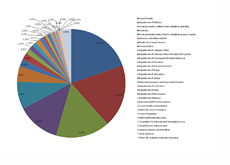
How Are Your Federal Tax Dollars Spent?
 Each and every year, the US federal government collects trillions of dollars from individuals and corporations in order to keep the country running.
 In 2010, the US government estimated that they would bring in just under $2.4 trillion in total receipts. Of this total, a little over $1 trillion ($1.061 trillion to be exact) was expected to be raised from individual income taxes, $940 billion from Social Security and payroll taxes, $222 billion from corporation income taxes, etc.
$2.4 trillion sounds like an impressive figure, but it doesn't even come close to covering the federal government's estimated expenditures for the 2010 fiscal year. President Obama's budget for 2010 totaled approximately $3.5 trillion, with $2.184 trillion being earmarked by mandatory spending, and an additional $1.368 trillion being earmarked for discretionary spending.
Mandatory spending is money that is automatically obligated due to pre-existing laws. This covers stuff such as Social Security, interest on the national debt, etc.
Discretionary spending, on the other hand, is money that is agreed upon by Congress on a yearly basis. This would cover things such as the Defense budget, education spending, etc.
So when you pay your assorted federal taxes each and every year, where does this money go? How exactly is it spent?
Let's break down federal spending based on every $1 in tax revenue that the federal government brings in. So, if you sent Uncle Sam $1 for your federal taxes this year, this is how it would be spent:
$1 Tax Revenues Equates To:
19 Cents Social Security
18.7 Cents Department of Defense
16.1 Cents (Other Mandatory Programs)
12.8 Cents (Medicare)
8.2 Cents (Medicaid)
4.6 Cents (Interest on National Debt)
3.0 Cents (Various Other Discretionary Expenses)
2.2 Cents (Department of Health and Human Services)
2.0 Cents (Department of Transportation)
1.5 Cents (Department of Veterans)
1.4 Cents (Department of State)
1.3 Cents (Department of Housing and Urban Development)
1.3 Cents (Department of Education)
1.2 Cents (Department of Homeland Security)
0.7 Cents (Department of Energy)
0.7 Cents (Department of Agriculture)
0.7 Cents (Department of Justice)
0.6 Cents (Small Business Administration, General Services Administration, Others)
0.5 Cents (National Aeronautics and Space Administration)
0.4 Cents (Department of Commerce)
0.4 Cents (Department of Labor)
0.4 Cents (Department of the Treasury)
0.3 Cents (Department of the Interior)
0.3 Cents (Environment Protection Agency)
0.3 Cents (Potential Disaster Costs)
0.3 Cents (Social Security Administration)
0.2 Cents (National Science Foundation)
0.1 Cents (Corps of Engineers)
0.1 Cents (National Infrastructure Bank)
--
Now, a few things should probably jump out at you here, such as:
-the US government spends more on the interest on its national debt than Transportation, Education and Homeland Security combined
-defense spending is the second largest expenditure
-the amount of money spent on Medicare and Medicaid just edges out the amount of money spent on defense

Source: Data.gov
Source: Wikipedia.org - 2010 United States Federal Budget
Filed under: General Knowledge


