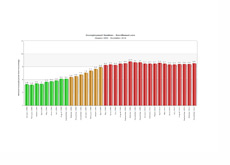
Unemployment Numbers Not Budging Much, Especially When Compared to Past Recessions
 In October of 2009, the US national unemployment rate hit a "Great Recession" peak of 10.2%.
 This is the highest that the unemployment rate has been since the start of the "Great Recession" back in December of 2007, though we are getting dangerously close to reaching 10.2% once again (the most recent unemployment number was 9.8%).
So, over the past 13 months, the national unemployment rate has dropped just 0.4%.
The question? How does this compare to previous recessions that have taken place in the United States since the end of World War II? Let's take a peek.
People will most often compare our current unemployment situation to what took place in the early '80s, as both recessions saw the national unemployment rate spike to over 10%.
In December of 1982, the unemployment rate in the United States topped out at 10.8% (it was also 10.8% the month before as well). At the time, the US economy was being savaged by an ugly mix of high inflation and weak economic activity (also known as stagflation). President Reagan, who would end up becoming one of the most popular US presidents of all time, suffered early blows to his approval rating as the national unemployment rate continued to soar after he took office in early 1981.
After topping out at 10.8% in December of 1982, what was the national unemployment rate 13 months later?
The answer? 8%. In January of 1984, 13 months after reaching a high of 10.8%, the national unemployment rate in the United States had retreated to 8%.
Now let's take a look at some of the other recessions that have occurred in the US since the end of WWII:
1973-1975 recession - the national unemployment rate reached a high during this cycle of 9% (May 1975). 13 months later (June 1976), the national unemployment rate was 7.6%.
Early 1990s recession - the national unemployment rate reached a high during this cycle of 7.8% (June of 1992). 13 months later (July 1993), the national unemployment rate was 6.9%.
Early 2000s recession - the national unemployment rate reached a high during this cycle of 6.3% (June 2003). 13 months later (July 2004), the national unemployment rate was 5.5%.
--
The national unemployment rate has remained remarkably flat during this current economic downturn, especially when compared to past recessions.
With the national unemployment rate expected to average 10% in 2011, you can expect more of the same over the coming months.

Source: Historical Unemployment Rates in the United States
Filed under: The Economic Meltdown


