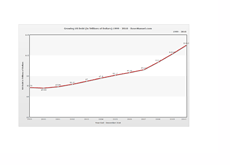
United States Has Added Over $8 Trillion To Its Debt Load Since December 31st, 1999
 On December 31st, 1999, the United States had a total of $5.77 trillion in total outstanding public debt.
 On December 31st, 2010, the United States had a total of $14.025 trillion in total outstanding public debt.
That means that over the past decade and a bit, the United States has nearly tripled its total debt load by adding an additional $8 trillion plus in new debt.
There are currently around 308 million residents of the United States according to the most recent Census numbers. This means that every man, woman and child in the United States has taken on an additional $26,632.38 in debt as their share of the outstanding public debt of the United States over the past 11 years.
--
From December 31st, 1999 to September 30th, 2001, the total public debt load of the United States barely budged (relatively speaking).
On December 31st, 1999, the United States had a total public debt load of $5.77 trillion. By September 30th, 2001, this number had grown to just $5.80 trillion.
In 1999, the United States posted a surplus of $125.6 billion. In 2000, the United States posted a surplus of $236.4 billion.
in 2009, the United States posted a deficit of $1.4 trillion. In 2010, the United States will likely post a deficit of around $1.2 trillion.
--
On December 31st, 1999, there was a great deal of teeth-gnashing over Y2K, but other than that, things were good.
As mentioned, the country was posting $100 billion+ surpluses.
The unemployment rate in December of 1999 was a microscopic 4%. Many companies were forced to go to great lengths to find qualified applicants due to the incredible strength of the job market in the country.
Many people were flush with cash thanks to a soaring stock market. The NASDAQ was particularly frothy at the time, closing 1999 at 4,069.31. Tech stocks were all the rage at the time, and many people were making small fortunes thanks to the "dot-com boom". This translated into even stronger tax receipts for the federal government.
--
Fast forward just 11 years, and the wheels have completely come off of the fast-moving locomotive previously known as the US economy.
9/11. The war in Afghanistan. The war in Iraq. The financial meltdown. The bank bailouts. The auto industry bailouts. The implosion of the US real estate market. The United States has sustained a number of body blows over the past 11 years, and was nearly knocked out in the fall of 2008.
The national unemployment rate in the country has increased from 4% to 9.4% in just over 10 years. Combine that with a plummeting real estate market and tepid consumer spending and you are left with decimated federal tax receipts.
In addition, the government has been forced to spend almost endlessly in order to keep the country afloat. Stimulus packages, bailouts, various other aid packages, etc. Revenues have plunged while expenses have soared - not a good mix.

By 2020, the United States is expected to have a total debt load of $20 trillion.
That means that the United States will have added roughly $14 trillion to its public debt load in just 20 years. That works out to a cool $700 billion per year.
The question becomes - when does the United States have its own full-fledged debt crisis?
Sources: Historical Unemployment Rates
Deficit and Surplus History in the United States
Where Did the Nasdaq/S&P 500/DJIA Trade On..
Filed under: The Economic Meltdown


