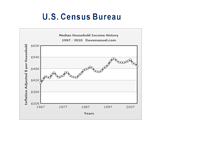
Inflated Adjusted Median Household Income Drops Below $50,000 For First Time Since 1996
 According to the US Census Bureau (link below), inflation adjusted median household income continued its descent in 2010, dropping to under $50,000 ($49,445 to be exact) for the first time since 1996.
 According to Wikipedia.org, median household income is defined as:
"..the amount which divides the income distribution into two equal groups, half having income above that amount, and half having income below that amount."
Let's take a quick look at the inflation adjusted median household income numbers in the United States since 1997:
2010 - $49,445
2009 - $50,599
2008 - $50,939
2007 - $52,823
2006 - $52,124
2005 - $51,739
2004 - $51,174
2003 - $51,353
2002 - $51,398
2001 - $52,005
2000 - $53,164
1999 - $53,252
1998 - $51,944
1997 - $50,123
Median household income in the United States came close to setting an all-time high back in 2007 (before the start of the "Great Recession"), but things have gone downhill since then, and fast.
Median household income in the country is nearly $4,000 less than what is was back in 1999. Things have gone from great to terrible since then, and this change has certainly played out in the nation's median household income number. In September of 1999, the national unemployment rate was 4.2%; in September of 2011, the national unemployment rate was 9.1%.
--
Any guesses as to when the nation's median household income (inflation adjusted) tops 1999's mark of $53,252?

Source: US Census Bureau
Source: Median Household Income History
Filed under: The Economic Meltdown


