
Swimming In Debt: $5 Trillion Added to US Debt Load Since President Obama Took Office
United States Has Public Debt Load of Over $15 Trillion
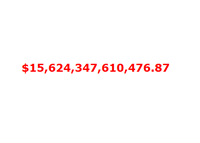
This means that every man, woman and child in the United States currently owes $51,426 for their share of the U.S. public debt.
As many in the media have pointed out over the past few days, the United States has taken on $5 trillion in new debt since Barack Obama took office on January 20th, 2009. Here are the exact numbers:
Now - $15,624,347,610,476.87
January 20th, 2009 - $10,626,877,048,913.08
As you can see - almost exactly $5 trillion in debt has been added since January 20th, 2009. President Obama has been in office for roughly 1,200 days, which means that the United States has taken on roughly $4 billion/day in new debt during his time in the White House so far.
As you can see from the numbers listed above, the United States currently has 47.2% more debt than it did when President Obama took office. Through President George W. Bush's first 1,200 days in office, the United States saw its debt load rise by approximately 24.1% ($5.73 trillion to $7.14 trillion).
President Obama's detractors point to the $5 trillion figure as proof positive that he isn't fit to lead the country and hasn't done anything to bring the country back to solid financial footing. President Obama's supporters point out that the US economy was in full collapse mode when he took office, and that President George W. Bush's last budget ended producing a deficit of $1.416 trillion.
One thing is for sure - the nation's debt load will be a central issue in the upcoming Presidential election.
Source: TreasuryDirect.gov - The Debt To the Penny
Keep reading
Economy and Politics · Oct 28, 2026The 2026 Early Vote Is Running Ahead of 2022. Who Does That Help?Economy and Politics · Oct 26, 2026Can Social Security Be Fixed? The Options and the PollsEconomy and Politics · Oct 25, 2026The Midterm Economy: How the US Is Really Doing Before the 2026 VoteEconomy and Politics · Oct 24, 2026Where the Money Went: Fiscal 2026 in Ten Charts
Filed under Economy and Politics. Every article, by year