Where Might Gas Prices Head Over The Next 5-10 Years?
 Earlier this week, I linked to an article in which John Hofmeister, former president of Shell Oil, proclaimed that the price of gasoline could hit $5 a gallon by 2012.
 The national average gas price has been slowly trending higher after crashing to an average of $1.616 a gallon in December of 2008 (the national average for a gallon of gas had hit $4.114 just a few months earlier). As it stands right now, the national average price for a gallon of regular unleaded gasoline is $3.071, with many market observers expecting this to spike in the months leading up to the summer.
With that being said, a number of people have emailed over the past few days, asking how the current price of gasoline compares to years past when adjusting for inflation. Did it cost more to fill your car in the 1950s on an inflation-adjusted basis? How about in the '70s and '80s, when the price of oil spiked due to multiple oil crises?
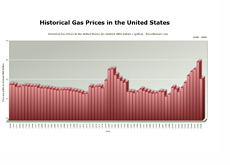
Fortunately for us, the Energy Information Administration (link below) has produced a handy chart that lets us look at the average price of gasoline from 1949-2009 in chained 2005 dollars.
If your inkling was that gas prices have never been higher (in inflation-adjusted terms) over the past number of years, then you would be right.
From 1949-1975, the Energy Information Administration only provides numbers for leaded regular gas prices, for obvious reasons.
Here are the inflation-adjusted average prices for a gallon of leaded regular from 1949-1975:
1949 - $1.85
1950 - $1.83
1951 - $1.73
1952 - $1.72
1953 - $1.78
1954 - $1.78
1955 - $1.75
1956 - $1.74
1957 - $1.75
1958 - $1.68
1959 - $1.66
1960 - $1.67
1961 - $1.64
1962 - $1.61
1963 - $1.58
1964 - $1.55
1965 - $1.57
1966 - $1.57
1967 - $1.57
1968 - $1.53
1969 - $1.51
1970 - $1.47
1971 - $1.43
1972 - $1.36
1973 - $1.38
1974 - $1.74
1975 - $1.69
It's interesting to note that spike in gas prices from 1973 to 1974 - this came as a result of the 1973 oil crisis, which resulted from the members of OAPEC enacting an oil embargo in response to "the US decision to re-supply the Israeli military" during the Yom Kippur war. The embargo lasted from October 1973 to March 1974, and resulted in dramatically higher oil and gas prices.
There was another energy crisis in 1979 when the Shah of Iran fled his country, throwing the Iranian oil sector into disarray. Things went from bad to worse after the Iraqi invasion of Iran in 1980, and the price of oil spiked as a result.
Let's look at average unleaded regular prices (in chained 2005 dollars) from 1976 through to 1983 as the United States dealt with yet another oil crisis:
1976 - $1.73
1977 - $1.74
1978 - $1.66
1979 - $2.06
1980 - $2.61
1981 - $2.64
1982 - $2.34
1983 - $2.15
The United States saw a noticeable uptick in the price of gas from 1976-1983, thanks to the situation in Iran.
Now let's look at gas prices from 1984-1992. This period of time includes the Gulf War and the recession that followed shortly after:
1984 - $2.03
1985 - $1.95
1986 - $1.47
1987 - $1.46
1988 - $1.41
1989 - $1.47
1990 - $1.61
1991 - $1.53
1992 - $1.47
The only really interesting piece of data here is the large drop of the price of gasoline in 1986. This came as a result of reduced demand and overproduction, which resulted in the short-term loss of OPEC unity.
Now let's look at 1993-2000, when the United States was in the midst of an incredible economic boom:
1993 - $1.42
1994 - $1.39
1995 - $1.41
1996 - $1.48
1997 - $1.46
1998 - $1.24
1999 - $1.34
2000 - $1.70
Gas prices remained relatively stable from 1993-1999 before enduring a sizable uptick in 2000 as the phenomenal run in US tech stocks started to come undone.
Now let's look at 2001-2009. This time period featured 9/11, the wars in Afghanistan and Iraq, the rise of the BRIC countries (Brazil, Russia, India, China) and a near global economic meltdown:
2001 - $1.61
2002 - $1.47
2003 - $1.69
2004 - $1.94
2005 - $2.30
2006 - $2.51
2007 - $2.64
2008 - $3.01
2009 - $2.14
The big story during this period of time was the continued rise of countries such as China and India, which has resulted in an increased demand for oil, gas and other commodities.

As you can see, 2008 was the high-water mark for gasoline in the United States on a historical basis.
However, with countries like China and India continuing to grow at a torrid pace, and with any number of geopolitical events popping up over the next couple of years, you can safely assume that we will take a strong run at $3.01 over the next 5-10 years.
Source: Energy Information Administration
Filed under: General Knowledge