Best First Half of Year Posted Since 1999
 The first half of 2013 closed with a whimper on Friday as the Dow Jones Industrial Average and S+P 500 averages both closed lower on the day.
 June was a rollercoaster month for the markets, thanks, in large part, to Ben Bernanke and the FOMC revealing that there is a tentative plan in place to scale back and eventually eliminate the $85 billion/month bond buying program that is currently ongoing. This tapering plan depends entirely on how the economy reacts over the coming months, but if things go according to the Fed's plan, the bond-buying program will cease to exist in 2014.
This news caught the markets off guard, sending the major indexes plummeting over a multi-day stretch. There was a recovery, but the big question remains - how will the markets react when the stimulus is removed entirely by the Federal Reserve?
--
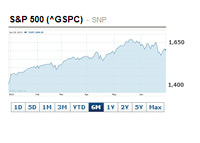
Let's take a look at where the DJIA, NASDAQ and S&P 500 started the year:
DJIA - 13,104.14
NASDAQ - 3,019.51
S&P 500 - 1,426.19
Here is where they finished up the first half:
DJIA - 14,909.60
NASDAQ - 3,403.25
S&P 500 - 1,606.28
--
The general consensus seems to be that the market is in for a rocky second half of the year.
What do you think?
Filed under: General Market News