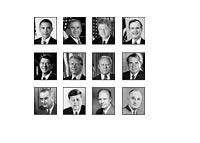
How Does Obama's 45% Approval Rating Compare to Previous Presidents?
 According to Gallup.com (link below), President Obama's most recent (Dec 19-25 poll) approval rating is 45%.
 President Obama is currently in his 12th quarter as President and has been in the White House for 1,067 days. With the 2012 election just around the corner, it becomes increasingly interesting to look at Obama's approval rating compared to previous Presidents after their first 1,067 days in the White House.
To start, the average approval rating after 1,067 days in the White House, from Truman to Obama, is 51.4%.
Let's start at George W. Bush and work backwards - here are the approval ratings of the last 11 Presidents of the United States after their first 1,067 days in the White House:
George W. Bush - 60%
Bill Clinton - 42%
George H.W. Bush - 46%
Ronald Reagan - 52%
Jimmy Carter - 56%
Gerald Ford - (no information available)
Richard Nixon - 49%
Lyndon B. Johnson - 44%
John F. Kennedy - N/A
Dwight Eisenhower - 76%
Harry Truman - 36%
Bill Clinton looked as though he might have troubles winning his re-election bid after his first 1,067 days in office, but he ended up surging and easily winning the 1996 Presidential election. By the time that voters hit the polls in November of 1996, Clinton had an approval rating in the mid 50s.
Jimmy Carter looked poised to cruise to a victory in 1980, but a rapidly deteriorating economy enabled Ronald Reagan to cruise to victory.
--
History tells us that President Obama is going to have a very hard time getting re-elected if his approval rating remains at its current level.
The good news for Obama supporters? President Obama is going to have an extremely well-funded re-election campaign, and this will no doubt boost his approval ratings heading into next year's election.
Source: Gallup.com
Filed under: General Knowledge


