Democrat Presidents Have Presided Over Much Larger Market Gains Over the Past 50 Years
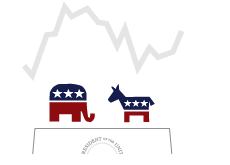 Another question that people e-mail us to ask all the time is - do the markets tend to perform better when a Democrat or Republican president is in the White House?
We went back to 1960 and ran the numbers (well, we went back to 1971 for the Nasdaq, as that is how far back the data goes for that particular exchange) up until 2009.
The results? Democrats by a landslide.
Here is a quick breakdown of the data:
DEMOCRAT PRESIDENTS
Dow, 21 Years, +9.6% avg
NASDAQ, 13 Years, +23.64% avg
S&P 500, 21 Years, +11.66% avg
REPUBLICAN PRESIDENTS
Dow, 29 Years, +4.97% avg
NASDAQ, 26 Years, +5.38% avg
S&P 500, 29 Years, +4.38% avg
--
So what does this data mean exactly?
Well, from 1960 through to 2009, Democrats have occupied the White House for a total of 21 years. In the years that the Democrats occupied the White House from 1960 to 2009, the DJIA returned an average of 9.6% per year, the NASDAQ returned an average of 23.64% per year, etc.
The Clinton Era (1993-2000) pumped up the averages tremendously for the Democrats, as the markets went completely berserk during this time.
We�ll see if the last three years of President Obama�s term end up helping or hurting the Democrat averages..
Filed under: General Knowledge