
Every Trillion of US National Debt, From 1981 to $39 Trillion and Counting
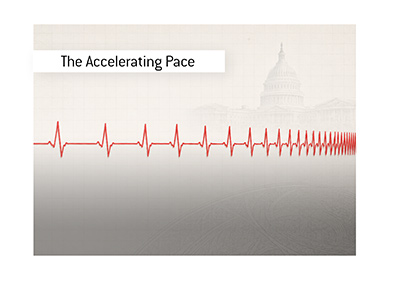 The United States government needed 205 years to borrow its first trillion dollars, crossing that line in October of 1981. It added its 38th trillion in 70 days last fall - with no war, no pandemic and no recession - and the gross national debt now sits at roughly $39.5 trillion, growing by about $7 billion per day. We pulled the date of every single trillion-dollar milestone from Treasury records, from the Reagan era to this past March, and lined them up on one accelerating timeline: how long each trillion took, which president was in office, the fastest crossings ever recorded, and when the $40 trillion mark is likely to fall. Interest on the debt now costs more per year than the entire national defense budget.
How Long Did It Take America to Add Each Trillion of National Debt?
The United States needed 205 years to borrow its first trillion dollars. It added its 38th trillion in 70 days - with no war, no pandemic, and no recession. This is the complete timeline.As I write this in July of 2026, the gross national debt of the United States sits at roughly $39.5 trillion, and it is growing by about $7 billion every single day. At the current pace, the $40 trillion milestone arrives right around the end of the fiscal year in September. Interest on that debt now costs taxpayers about $1 trillion per year - more than the United States spends on its entire national defense.
Numbers that large stop meaning anything, so here is a different way to look at it. Instead of asking how big the debt is, we asked: how long did it take to add each individual trillion? Every crossing has a date in the Treasury's records, from the very first trillion in October 1981 to the 39th this past March. Lay those dates end to end and you get the single most alarming chart in American fiscal history - a timeline that starts with gaps measured in centuries and decades, and ends with gaps measured in weeks.
How are we counting?
We are using gross federal debt - the total public debt outstanding from the Treasury's Debt to the Penny dataset, which includes both debt held by the public and intragovernmental holdings (mostly the Social Security trust funds). It is the figure the famous debt clock tracks, the one that generates the headlines each time a milestone falls, and the one our own US Debt Clock page follows.
Two housekeeping notes. Treasury reporting before the late 1990s was monthly rather than daily, so crossings from the 1980s and early 1990s are dated to the month (marked with an asterisk in the table). And the dollar milestones are nominal - a 1981 trillion and a 2026 trillion are very different amounts of real money, which we deal with in a note at the bottom rather than pretending it away.
| Milestone | Date crossed | Time to add | President |
|---|---|---|---|
| $1 trillion | October 22, 1981 | 205 years | Reagan |
| $2 trillion | April 1986* | 4.5 years | Reagan |
| $3 trillion | October 1990* | 4.5 years | G.H.W. Bush |
| $4 trillion | September 1992* | 701 days | G.H.W. Bush |
| $5 trillion | February 1996* | 3.4 years | Clinton |
| $6 trillion | February 26, 2002 | 6.0 years | G.W. Bush |
| $7 trillion | January 2004* | 688 days | G.W. Bush |
| $8 trillion | October 18, 2005 | 642 days | G.W. Bush |
| $9 trillion | September 2007* | 697 days | G.W. Bush |
| $10 trillion | September 30, 2008 | 381 days | G.W. Bush |
| $11 trillion | March 16, 2009 | 167 days | Obama |
| $12 trillion | November 16, 2009 | 245 days | Obama |
| $13 trillion | June 1, 2010 | 197 days | Obama |
| $14 trillion | December 31, 2010 | 213 days | Obama |
| $15 trillion | November 15, 2011 | 319 days | Obama |
| $16 trillion | September 4, 2012 | 294 days | Obama |
| $17 trillion | October 17, 2013 | 408 days | Obama |
| $18 trillion | December 15, 2014 | 424 days | Obama |
| $19 trillion | January 29, 2016 | 410 days | Obama |
| $20 trillion | September 8, 2017 | 588 days | Trump |
| $21 trillion | March 15, 2018 | 188 days | Trump |
| $22 trillion | February 11, 2019 | 333 days | Trump |
| $23 trillion | October 31, 2019 | 262 days | Trump |
| $24 trillion | April 7, 2020 | 159 days | Trump |
| $25 trillion | May 5, 2020 | 28 days | Trump |
| $26 trillion | June 10, 2020 | 36 days | Trump |
| $27 trillion | October 1, 2020 | 113 days | Trump |
| $28 trillion | March 1, 2021 | 151 days | Biden |
| $29 trillion | December 2021* | 292 days | Biden |
| $30 trillion | January 31, 2022 | 44 days | Biden |
| $31 trillion | October 3, 2022 | 245 days | Biden |
| $32 trillion | June 15, 2023 | 255 days | Biden |
| $33 trillion | September 15, 2023 | 92 days | Biden |
| $34 trillion | December 29, 2023 | 105 days | Biden |
| $35 trillion | July 26, 2024 | 210 days | Biden |
| $36 trillion | November 21, 2024 | 118 days | Biden |
| $37 trillion | August 12, 2025 | 264 days | Trump |
| $38 trillion | October 21, 2025 | 70 days | Trump |
| $39 trillion | March 2026* | 155 days | Trump |
A note on the structure
Thirty-nine milestones is too many to walk through one by one, so we grouped them into seven eras. The lopsidedness is deliberate: the first trillion gets the longest section because it contains 205 years of history, and the most recent trillions get the shortest sections because, frankly, there is barely any time inside them to describe. That asymmetry is the entire article in miniature.
ERA 1The First Trillion: 1776-1981
The United States was born in debt - about $75 million of it once Alexander Hamilton federalized the states' Revolutionary War obligations in 1791. For the next two centuries, the pattern was remarkably disciplined: debt exploded during wars and was steadily paid down afterward. The Civil War took it from $65 million to $2.8 billion. World War I pushed it to $27 billion. World War II took it from $49 billion to $269 billion - and even that was substantially worked down, relative to the economy, over the following three decades.
The trillion-dollar line finally fell on October 22, 1981, nine months into Ronald Reagan's first term. Reagan had spent that whole year calling the figure incomprehensible - famously telling Congress in February 1981 that a trillion dollars in thousand-dollar bills would make a stack 67 miles high. It had taken the republic 205 years, 39 presidents, and every war from the Revolution to Vietnam to borrow its first trillion.
ERA 2Trillions 2-4: The Reagan-Bush Run (1986-1992)
Having taken two centuries to reach one trillion, Washington needed less than five years to reach two. The 1981 tax cuts, the defense buildup, and the 1982 recession combined to produce peacetime deficits without precedent, and the debt roughly tripled across the Reagan years. The $3 trillion mark fell in the fall of 1990 just as Congress and George H.W. Bush were negotiating the famous "read my lips" budget deal, and the $4 trillion mark arrived on the eve of the 1992 election - which Ross Perot spent turning the debt into a national obsession, charts and all.
ERA 3Trillion 5 and the Long Pause (1996-2002)
Here is the stretch nobody remembers: the six years between the $5 trillion crossing in early 1996 and the $6 trillion crossing in early 2002 remain the longest gap between trillion milestones in the modern era. The 1990s boom, the 1993 and 1997 budget deals, and four consecutive federal surpluses from 1998 through 2001 essentially froze the debt in place. In fiscal 2000, debt held by the public actually fell by more than $200 billion - and serious people in Washington published papers worrying about what would happen to financial markets when the Treasury bond disappeared entirely.
ERA 4Trillions 6-10: Wars, Tax Cuts and a Crisis (2002-2008)
The surplus era ended abruptly: the 2001 recession, the 2001 and 2003 tax cuts, two wars, and a new Medicare drug benefit put the debt back on an escalator. The pace settled into a trillion roughly every 20 months - shocking by any prior standard, quaint by what came next. The $10 trillion milestone fell on September 30, 2008, in the teeth of the financial crisis, two weeks after Lehman Brothers failed. The famous National Debt Clock near Times Square literally ran out of digits and had to sacrifice its dollar sign to display the number.
ERA 5Trillions 11-19: The Great Recession Decade (2009-2016)
The financial crisis rewrote the scale. Collapsing revenues, automatic stabilizers, TARP, and the stimulus produced trillion-plus deficits four years running, and the debt crossed three separate trillion marks between March 2009 and June 2010. The pace then eased as the recovery matured and the 2011 Budget Control Act caps bit - the gaps stretched back out past 400 days by mid-decade - but the ratchet only ever turned one way. The debt that stood at $10.6 trillion when Barack Obama took office stood at $19.9 trillion when he left.
ERA 6Trillions 20-27: Tax Cuts, Then COVID (2017-2020)
The debt was already re-accelerating before anyone had heard of COVID - the 2017 tax cuts and the 2018-19 spending deals had the gaps back under a year, with three trillions crossed between March 2018 and October 2019 during a strong economy. Then the pandemic hit, and fiscal history simply broke. Between April 2020 and March 2021, the CARES Act and its successors pushed roughly $5 trillion of borrowing out the door. The $24 trillion mark fell on April 7, 2020. The $25 trillion mark fell on May 5 - 28 days later, the fastest trillion ever added, a pace of roughly $36 billion per day. Four trillion-dollar milestones fell in calendar 2020 alone.
ERA 7Trillions 28-36: The Post-COVID Plateau That Wasn't (2021-2024)
The emergency ended. The emergency-sized borrowing did not. With the economy fully recovered and unemployment near record lows, the debt kept adding a trillion roughly every five months - the American Rescue Plan, then the bipartisan infrastructure and chips bills, and increasingly something new: interest itself. As the Fed raised rates to fight inflation, the cost of servicing the existing debt exploded, and by 2024 Washington was borrowing hundreds of billions per year just to pay interest on what it had already borrowed. The $33 trillion and $34 trillion milestones fell 105 days apart in late 2023, in a growing economy, without a single new crisis to blame.
ERA 8Trillions 37-39: The Current Sprint (2025-2026)
Which brings us to now. The $37 trillion mark fell last August - five years ahead of what the Congressional Budget Office projected back in January 2020. Then came the one that should have gotten more attention than it did: $38 trillion on October 21, 2025, just 70 days later - the fastest trillion ever added outside the COVID emergency, and it happened during a government shutdown, with no recession, no war mobilization, and no pandemic. The $39 trillion mark followed this past March, about 155 days after that. The Joint Economic Committee puts the current pace at roughly $7 billion per day, which works out to about $84,000 per second.
Which presidents were in office for the most milestones?
What does $39.5 trillion actually cost?
The abstract number lands differently when you break it down. Per the Joint Economic Committee's 2026 figures, the gross debt works out to roughly $114,000 per person and $288,000 per household. Gross interest on the debt is running at about $1 trillion per year - more than the entire defense budget, more than Medicare benefits, and second only to Social Security among federal outlays. And measured against the economy, the debt now stands at roughly 123-124% of GDP, which means America has surpassed the all-time record of 119% set in 1946 - a level that previously required the largest war in human history to reach.
That last comparison is the one worth sitting with. The 1946 peak was the price of defeating fascism, and it was worked down for three decades afterward. The 2026 level was reached in peacetime prosperity, and every official projection points up.
So when does the next trillion arrive?
Soon. At the roughly $7 billion daily pace, the $40 trillion milestone lands right around the end of fiscal 2026 in late September - which would make five trillion-dollar milestones in a little over two years. The CBO's long-run projections have gross debt approaching $60 trillion within a decade under current law, and the recent tax-and-spending package is projected to add roughly $4 trillion beyond that baseline over ten years. Nothing on the books bends the line down.
The honest summary of 45 years of this timeline: no milestone has ever slowed the borrowing, no party has reversed it while holding power, and the only sustained pause came from an economic boom that ended a quarter century ago. The clock that ran out of digits in 2008 has needed two more since.
The Bottom Line
The United States took 205 years to accumulate its first trillion dollars of debt - and 70 days to add its 38th. The full timeline runs from October 22, 1981 ($1 trillion, Reagan) through March 2026 ($39 trillion), with the pace accelerating in every era: 4-5 years per trillion in the 1980s, roughly 20 months in the 2000s, about 5 months in the 2020s.The fastest trillion ever was the COVID emergency trillion of spring 2020 (28 days). The most alarming was the most recent record: $37 trillion to $38 trillion in 70 days in late 2025, with no crisis at all. Interest now costs about $1 trillion per year - more than defense - and the debt has passed its World War II record share of the economy.
At roughly $7 billion of new borrowing per day, the $40 trillion milestone arrives around the end of fiscal 2026. Whatever else changes in Washington, this timeline has only ever compressed.
Filed under: General Knowledge